[Supervised Learning] SVM – Support Vector Machine explained with examples

This post is the first part of a double post about SVMs. This part tries to help to clarify how SVMs work in theory (with 2 full developed examples). The second part (not published yet) will explain the algorithm to solve this problem using a computer: Quadratic Programming and SMO.

Index

Basic definition

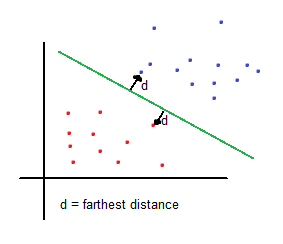
Support vector machines (SVMs from now on) are supervised learning models used for classification and regression. The basic idea of SVMs in binary classification is to find the farthest boundary from each class.

basicsvm

Therefore, solving a basic mathematical function given the coordinates (features) of each sample will tell whether the sample belongs to one region (class) or other. Input features determine the dimension of the problem. To keep it simple, the explanation will include examples in 2 dimensions.

Mathematical explanation

expl1

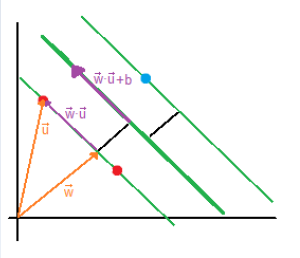
The vector [latex]\overrightarrow{w}[/latex] is a perpendicular vector to the boundary, but since boundary’s coefficients are unknown, [latex]\overrightarrow{w}[/latex] vector’s coefficients are unknown as well. What we want to do is to calculate the boundary’s coefficients with respect to [latex]\overrightarrow{u}[/latex] because we have its coordinates (sample’s coordinates).

expl3

If both vectors are multiplied, the result will be the purple vector.
[latex]\overrightarrow{w} \cdot \overrightarrow{u} \geq c \quad \text{or generally} \quad \overrightarrow{w} \cdot \overrightarrow{u} + b \geq 0[/latex]

Let us say that:
[latex]\overrightarrow{w} \cdot \overrightarrow{x_+} + b \geq 1 \quad \text{and} \quad \overrightarrow{w} \cdot \overrightarrow{x_-} + b \leq -1[/latex]
Where [latex]\overrightarrow{x_+}[/latex] is a positive sample (class A) and [latex]\overrightarrow{x_-}[/latex] is a negative sample (class B).
A new variable is now introduced:
[latex]y_i \quad \text{such that } y_i = +1 \quad \text{for + samples} \\
\text{ } \hspace{70pt} y_i = -1 \quad \text{for – samples}[/latex]

Multiply each of them by the previous equations:
[latex]y_i(\overrightarrow{x_i} \cdot \overrightarrow{w}+b) \geq 1 \\
+1 * (\overrightarrow{x_i} \cdot \overrightarrow{w}+b) \geq 1 \\
-1 * (\overrightarrow{x_i} \cdot \overrightarrow{w}+b) \geq 1[/latex]

The result is the same equation. Therefore, we only need the previous formula:
[latex]y_i(\overrightarrow{x_i} \cdot \overrightarrow{w}+b) \geq 1 \quad \to \quad y_i(\overrightarrow{x_i} \cdot \overrightarrow{w}+b) -1 \geq 0[/latex]

expl4

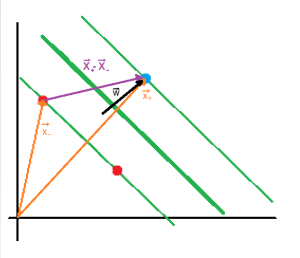
Finally, we add an additional constrain [latex]y_i(\overrightarrow{x_i} \cdot \overrightarrow{w}+b) -1 = 0[/latex] so that the values that fulfill this, fall in between the two regions as depicted (green zone).

expl5

The next step is to maximize the projection of [latex]\overrightarrow{x_+}-\overrightarrow{x_-}[/latex] on [latex]\overrightarrow{w}[/latex] (the black perpendicular vector to the boundary) to keep samples from each class as far as possible. I assume that you know about scalar projection, but if you don’t, you can check out the Appendix A.

The length of the projection is given by the following formula:
[latex](x_+ – x_-) \cdot \frac{\overrightarrow{w}}{\| w \|}[/latex]

From the previous formula [latex]y_i(\overrightarrow{x_i} \cdot \overrightarrow{w}+b) -1 = 0[/latex] now let us substitute both positive and negative samples [latex]x_+[/latex] and [latex]x_-[/latex] so that:
[latex]y_i = +1 \quad \to \quad 1(\overrightarrow{x_+} \cdot \overrightarrow{w} + b) -1 = 0 \quad \to \quad \overrightarrow{x_+} \cdot \overrightarrow{w} = 1-b \\
y_i = -1 \quad \to \quad -1(\overrightarrow{x_-} \cdot \overrightarrow{w} + b) -1 = 0 \quad \to \quad \overrightarrow{x_-} \cdot \overrightarrow{w} = -1-b [/latex]

Therefore:
[latex](x_+ – x_-) \cdot \frac{\overrightarrow{w}}{\| w \|} = \frac{\overrightarrow{x_+} \cdot \overrightarrow{w}-\overrightarrow{x_-} \cdot \overrightarrow{w}}{\| w \|} = \frac{1-b+1+b}{\| w \|} = \frac{2}{\| w \|}[/latex]

The goal is to maximize [latex]\frac{2}{\| w \|}[/latex] which is the same as minimizing [latex]\| w \|[/latex] or, to make it more mathematically convenient, [latex]\frac{1}{2}\| w \|^2[/latex]

Thus, we have a function to minimize with a constraint ([latex]y_i(\overrightarrow{x_i} \cdot \overrightarrow{w} + b) -1 = 0 [/latex]), so Lagrange is applied. In case you want to know more about Lagrange multipliers, you can check Appendix B.

[latex]L = \frac{1}{2}\| w \|^2 – \sum \alpha_i [ y_i (\overrightarrow{w} \cdot \overrightarrow{x_i} +b)-1][/latex]
First we have the function we want to minimize, and later the constraints.

[latex]\frac{\partial L}{\partial w} = \overrightarrow{w} – \sum \alpha_i y_i x_i = 0 \to \overrightarrow{w} = \sum \alpha_i y_i x_i \\
\frac{\partial L}{\partial b} = – \sum \alpha_i y_i = 0 \to \sum \alpha_i y_i = 0[/latex]

Plug these two functions to [latex]L[/latex].

[latex]L = \frac{1}{2}(\sum \alpha_i y_i \overrightarrow{x_i}) \cdot (\sum \alpha_j y_j \overrightarrow{x_j}) – (\sum \alpha_i y_i \overrightarrow{x_i}) \cdot (\sum \alpha_j y_j \overrightarrow{x_j}) – \sum \alpha_i y_i b + \sum \alpha_i = \sum \alpha_i – \frac{1}{2} \sum_i \sum_j \alpha_i \alpha_j y_i y_j \overrightarrow{x_j} \cdot \overrightarrow{x_j}[/latex]

Hence, we aim to minimize [latex]\sum \alpha_i – \frac{1}{2} \sum_i \sum_j \alpha_i \alpha_j y_i y_j \overrightarrow{x_j} \cdot \overrightarrow{x_j}[/latex]
The optimization depends on [latex]\overrightarrow{x_j} \cdot \overrightarrow{x_j}[/latex]

Kernel trick

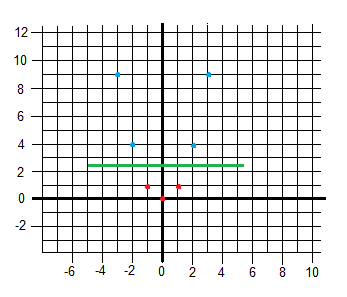
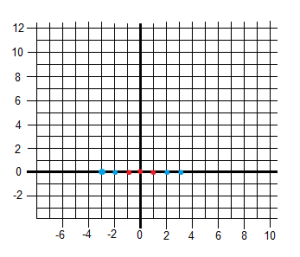
One of the most interesting properties of SVMs is that we can transform problems from a certain number of dimensions to another dimensional space. This flexibility, as known as kernel trick, allows SVMs to classify nonlinear problems.
kernel1

kernel2

[latex]\text{from } \quad f(x) \quad \text{ to } \quad f(x,x^2)[/latex]

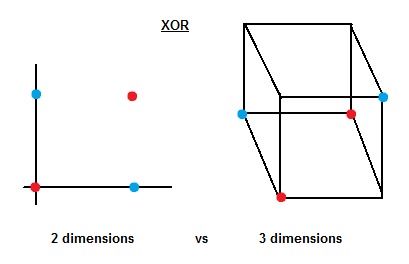
The following example shows how to graphically solve the XOR problem using 3 dimensions.

xorprob

Now it is not difficult to imagine a plane that can separate between blue and red samples.

Example 1: 2 points in a plane
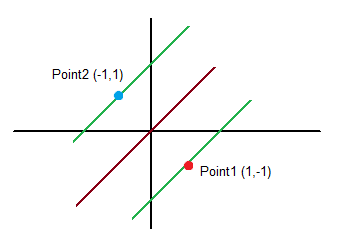
problem1
Points and class (coordinate x (x1), coordinate y (x2), class/output (y)):

Point 1:

Coordinates: [latex]x = [-1,1][/latex]
Class (output): [latex]y = 1[/latex]

Point 2:

Coordinates: [latex]x = [1,-1][/latex]
Class (output): [latex]y = -1[/latex]

We want to minimize: [latex]\sum_{i=1}^N \alpha_i – \frac{1}{2} \sum_{i=1}^N \sum_{i=1}^N \alpha_i \alpha_j y_i y_j x_i^T \cdot x_j[/latex]
We know that: [latex]w = \sum_{i=1}^N \alpha_i y_i x_i[/latex]
and [latex]\sum_{i=1}^N \alpha_i y_i = 0[/latex]

Let us calculate the second part of the function we want to minimize first to keep it simple:
[latex]
L_1 = \begin{cases} \alpha_1 * \alpha_1 * 1 * 1 * (-1 * -1 + 1*1) = 2 \alpha_1^2\\
\alpha_1 * \alpha_2 * 1 * -1 * (-1 * 1 + 1*-1) = 2 \alpha_1 \alpha_2 \\
\alpha_2 * \alpha_1 * -1 * 1 * (1 * -1 + -1*1) = 2 \alpha_1 \alpha_2 \\
\alpha_2 * \alpha_2 * -1 * -1 * (1 * 1 + -1*-1) = 2 \alpha_2^2 \end{cases} = 2 \alpha_1^2 + 2 \alpha_1 \alpha_2 + 2 \alpha_1 \alpha_2 + 2 \alpha_2 \\
[/latex]

[latex]L = \alpha_1 + \alpha_2 – \frac{1}{2} (2 \alpha_1^2 + 2 \alpha_1 \alpha_2 + 2 \alpha_1 \alpha_2 + 2 \alpha_2) = \alpha_1 + \alpha_2 – 2 \alpha_1 \alpha_2 – \alpha_1^2 – \alpha_2^2[/latex]

[latex]
\vspace{2 em}
\frac{\partial L}{\partial \alpha_1} = 0 \quad \to \quad -2 \alpha_1 – 2 \alpha_2 +1 = 0 \quad \to \quad \alpha_1 + \alpha_2 = \frac{1}{2} \\
\frac{\partial L}{\partial \alpha_2} = 0 \quad \to \quad -2 \alpha_2 – 2 \alpha_1 +1 = 0 \quad \to \quad \alpha_1 + \alpha_2 = \frac{1}{2} [/latex]

[latex]
\vspace{2 em}
\sum_{i=1}^N \alpha_i y_i = 0 \quad \to \quad 1 \alpha_1 – 1 \alpha_2 = 0 \quad \to \quad \alpha_1 = \alpha_2
[/latex]

Ergo:

[latex]\alpha_1 = \alpha_2 = \frac{1}{4}[/latex]

Now let us calculate [latex]\overrightarrow{w}[/latex]:

[latex]\overrightarrow{w} = \sum_{i=1}^N \alpha_i y_i x_i = \frac{1}{4} * 1 * [-1,1] + \frac{1}{4} * -1 * [1,-1] = [\frac{-1}{4} , \frac{1}{4}] + [\frac{-1}{4} , \frac{1}{4}] = [\frac{-2}{4} , \frac{2}{4}] = [\frac{-1}{2} , \frac{1}{2}][/latex]

Now we have to figure out the bias
[latex]\alpha [y_i (\overrightarrow{w}^T\overrightarrow{x_i} +b) -1] = 0 \quad \to \quad \alpha_i y_i \overrightarrow{w}^T\overrightarrow{x_i} + \alpha_i b y_i – \alpha_i = 0 \\
b = \frac{1-y_i \overrightarrow{w}^T\overrightarrow{x_i}}{y_i} \quad \to \quad b = \frac{1}{y_i} – \overrightarrow{w}^T\overrightarrow{x_i}[/latex]

[latex]
\text{for i=1} \\
\text{ } \hspace{3em} b = 1 -[(-1,1) \cdot (\frac{-1}{2},\frac{1}{2})] = 0 \\
\text{for i=2} \\
\text{ } \hspace{3em} b = – 1 -[(1,-1) \cdot (\frac{-1}{2},\frac{1}{2})] = 0
\vspace{3em}
\text{ }[/latex]

Solution = [latex]\frac{-1}{2}x+\frac{1}{2}y=0 \quad \to \quad x-y=0[/latex]

Example 2: 3 points in a plane
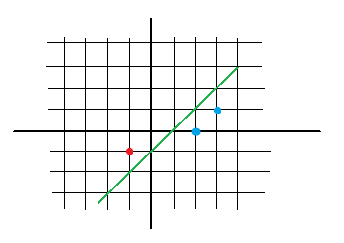
problem2
Points and class (coordinate x (x1), coordinate y (x2), class/output (y)):

Point 1:

Coordinates: [latex]x = [-1,-1][/latex]
Class (output): [latex]y = -1[/latex]

Point 2:

Coordinates: [latex]x = [2,0][/latex]
Class (output): [latex]y = 1[/latex]

Point 3:

Coordinates: [latex]x = [3,1][/latex]
Class (output): [latex]y = 1[/latex]

First let us calculate the second part of the function we want to minimize. You can see both alphas being multiplied by two numbers. The first number is the product of [latex]y_i[/latex] and [latex]y_j[/latex]. The second number is the dot product between the two coordinates [latex]\overrightarrow{x_i} \cdot \overrightarrow{x_j}[/latex].
[latex]
L_1 = \begin{cases} \alpha_1 * \alpha_1 * 1 * 2\\
\alpha_1 * \alpha_2 * -1 * -2 \\
\alpha_2 * \alpha_1 * -1 * -4 \\
\alpha_2 * \alpha_2 * -1 * -2 \\
\alpha_1 * \alpha_2 * 1 * 4 \\
\alpha_2 * \alpha_1 * 1 * 6 \\
\alpha_2 * \alpha_2 * -1 * -4 \\
\alpha_1 * \alpha_2 * 1 * 6 \\
\alpha_2 * \alpha_1 * 1 * 10 \end{cases} = 2 \alpha_1^2 + 4 \alpha_1 \alpha_2 + 8 \alpha_1 \alpha_3 + 4 \alpha_2^2 + 12 \alpha_2 \alpha_3 + 10 \alpha_3^2 = 0 \\
\text{Apply } \alpha_1 = \alpha_2 + \alpha_3 \text{ and } \frac{-1}{2} \\
2 \alpha_2 + 2 \alpha_3 – 5 \alpha_2^2 – 10 \alpha_3^2 – 14 \alpha_2 \alpha_3 = 0
\vspace{1em}
\text{  }
[/latex]

[latex]
\frac{\partial L}{\partial \alpha_2} = 2 – 10 \alpha_2 – 14 \alpha_3 = 0 \\
\frac{\partial L}{\partial \alpha_3} = 2 – 14 \alpha_2 – 20 \alpha_3 = 0 \\
\alpha_2 = 3, \alpha_3 = -2, \alpha_1 = 1
[/latex]

[latex]w = 1*-1*[-1,-1] + 3*1*[2,0] – 2*1*[3,1] = [1,-1] \\
b_1 = b_2 = b_3 = -1[/latex]

Result: [latex]x – y -1 = 0[/latex]

Appendix A: Scalar Projection of Vectors

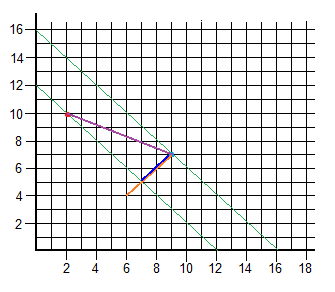
vecpro

We have two points and its vector:
[latex]R = [2,10] \quad \text{(red)} \\
B = [9,7] \quad \text{(blue)} \\
\overrightarrow{RB} = (7,-3)[/latex]

And we want to calculate the length of the vector’s projection (purple) on the orange vector [latex]\overrightarrow{O}[/latex] (which by the way, is the perpendicular of both green lines). The result is the blue vector which is over the orange one within the green region.

For this, we have to solve the formula:
[latex]\overrightarrow{RB} \cdot \frac{\overrightarrow{O}}{\| O \|} \\
(7,-3) \cdot \frac{(3,3)}{\sqrt{3^2 + 3^2}} \\
\frac{7*3-3*3}{\sqrt{18}} = 2\sqrt{2}
[/latex]

Now with the length and the angle, we can calculate the coordinates using sine and cosine functions.
[latex]x_{relative} = 2\sqrt{2} * \cos{(180 + 45)} = -2 \\
x_{relative} = 2\sqrt{2} * \sin{(180 +45)} = -2[/latex]

B was in [9,7], so the point on the other side of the projection is [latex][9-2,7-2] \to [7,5] [/latex]

Appendix B: Lagrange Multipliers

Lagrange is a strategy to find local maxima and minima of a function subject to equality constraints, i.e. max of [latex]f(x,y)[/latex] subject to [latex]g(x,y)=c[/latex]. [latex]f(\cdot)[/latex] and [latex]g(\cdot)[/latex] need to have continuous first partial derivatives.

[latex]\text{ } \quad \wedge (x,y,\lambda) = f(x,y) + \lambda(g(x,y)-c) \quad \lambda \text{ may be positive or negative}[/latex]

If [latex]f(x_0,y_0)[/latex] is a maximum of [latex]f(x,y)[/latex] for the original constrained problem, then there exists [latex]\lambda[/latex] such that [latex](x_0,y_0,\lambda_0)[/latex] is a stationary point for Lagrange function (so [latex]\partial \wedge[/latex] is 0).

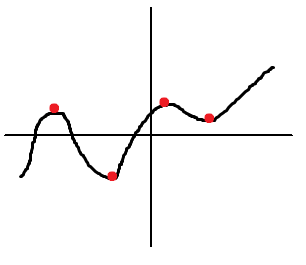
localmaxmin

In mathematics, a stationary point of a differentiable function of one variable is a point of the function domain where the derivative is zero. For a function of several variables, the stationary point is an input whose all partial derivatives are zero (gradient zero). They correspond to local maxima or minima.

surface

To make it clear, let us say that we have a surface [latex]g(x,y,z)[/latex] whose gradient is [latex]\Delta g[/latex] and it is perpendicular to the whole surface. We try to find its maxima whose gradient should theoretically be perpendicular as well. Let us not forget the relationship between the first derivative and the gradient. Hence we can say that the gradient of [latex]g[/latex] and the gradient of [latex]f[/latex] are pointing in the same direction so: [latex]\overrightarrow{\Delta f} = \lambda \overrightarrow{\Delta g}[/latex] (proportional). [latex]\lambda[/latex] is called Lagrange multiplier.

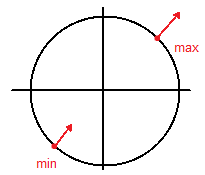
Example 1: 1 constraint, 2 dimensions

Maximize [latex]f(x,y) = 3x+3y[/latex] on unit circle [latex]x^2+y^2=1 \to g(x,y) = x^2+y^2-1[/latex]

[latex]\frac{\partial f}{\partial x} = \lambda \frac{\partial g}{\partial x} \to 3 = 2x \lambda \to x = \frac{3}{2 \lambda}\\
\frac{\partial f}{\partial y} = \lambda \frac{\partial g}{\partial y} \to 3 = 2y \lambda \to y = \frac{3}{2 \lambda}[/latex]

Now we plug these results into the original equation.

[latex]x^2 + y^2 = 1 \to \frac{9+9}{4 \lambda^2} = \frac{18}{4 \lambda^2} = 1 \to \lambda = \pm \frac{\sqrt{18}}{2} = 2.12 [/latex]

Therefore we have two points:
[latex](x,y) = (0.707,0.707) \quad \text{or} \quad (x,y) = (-0.707,-0.707) \quad \text{so} \quad f(x,y) = 2.12 \quad \text{or} \quad -2.12[/latex]

exampl1

Example 2: 1 constraint, 2 dimensions

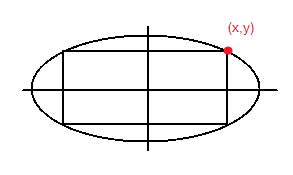
Find the rectangle of maximal perimeter that can be inscribed in the ellipse [latex]x^2+4y^2=4[/latex]. We want to maximize the perimeter which is [latex]f(x,y) = 4x+4y[/latex] subject to [latex]g(x,y) = x^2 +4y^2 -4[/latex]

exampl2

[latex]\frac{\partial f}{\partial x} = \lambda \frac{\partial g}{\partial x} \to 4 = 2x \lambda \\
\frac{\partial f}{\partial y} = \lambda \frac{\partial g}{\partial y} \to 4 = 8y \lambda \\
x = 4y[/latex]

Now plug it into the original equation.

[latex]x^2+4y^2 = 4 \quad \to \quad 20y^2=4 \quad \to \quad y = \pm \sqrt{\frac{1}{5}}, \quad x=\frac{4}{\sqrt{5}} \quad [/latex] (we take the positive because it is a maximum),

Then, [latex]P = (\frac{4}{\sqrt{5}},\frac{1}{\sqrt{5}})[/latex]
So the maximum permieter is: [latex]f(x,y) = 4x+4y = 4* \frac{4}{\sqrt{5}}+4* \frac{1}{\sqrt{5}} = 4 \sqrt{5}[/latex]

Example 3: 2 constraints, 3 dimensions

[latex]f(x,y,z) = x^2 + y^2 + z^2 \quad \text{subject to} \quad x+y+z=1 \to g_1(x,y,z) = x+y+z-1 \\
\text{ } \hspace{140pt} \text{and } x+2y+3z = 6 \to g_2(x,y,z) = x+2y+3z-6 \\
\vspace{15pt} \\
[/latex]
[latex]
\frac{\partial f}{\partial x} = \lambda_1 \frac{\partial g_1}{\partial x} + \lambda_2 \frac{\partial g_2}{\partial x} \quad \to \quad 2x = \lambda_1 + \lambda_2 \quad \to \quad x = \frac{\lambda_1 + \lambda_2}{2}\\
\frac{\partial f}{\partial y} = \lambda_1 \frac{\partial g_1}{\partial y} + \lambda_2 \frac{\partial g_2}{\partial y} \quad \to \quad 2y = \lambda_1 + 2 \lambda_2 \quad \to \quad y = \frac{\lambda_1 + 2 \lambda_2}{2}\\
\frac{\partial f}{\partial z} = \lambda_1 \frac{\partial g_1}{\partial z} + \lambda_2 \frac{\partial g_2}{\partial z} \quad \to \quad 2z = \lambda_1 + 3 \lambda_2 \quad \to \quad z = \frac{\lambda_1 + 3 \lambda_2}{2}\\[/latex]

Now plug it into [latex]g_1(x,y,z)[/latex] and [latex]g_2(x,y,z)[/latex]:

[latex]\frac{\lambda_1 + \lambda_2}{2} + \frac{\lambda_1 + 2 \lambda_2}{2} + \frac{\lambda_1 + 3 \lambda_2}{2} = 1 \quad \to \quad 3 \lambda_1 + 6 \lambda_2 = 2 \\
\frac{\lambda_1 + \lambda_2}{2} + \lambda_1 + 2 \lambda_2 + \frac{3}{2} (\lambda_1 + 3 \lambda_2) = 6 \quad \to \quad 6 \lambda_1 + 14 \lambda_2 = 12 \\
\lambda_2 = -4, \quad \lambda_1 = \frac{-22}{3} \\
x = \frac{-5}{3}, \quad y = \frac{1}{3}, \quad z = \frac{7}{3} \\
f(x,y,z) = x^2 + y^2 + z^2 \quad f(\frac{-5}{3}, \frac{1}{3}, \frac{7}{3}) = \frac{25}{3}
[/latex]

Since this is a parabola in 3 dimensions, this has no maximum, so it is a minimum.
Post Index

[P] Python code
[M] Matlab code

Deep Learning and Tensorflow

[P] Image style transfer using convolutional neural networks – Tensorflow implementation
[P] Difference between L1 and L2 regularization, implementation and visualization in Tensorflow
[P] How to freeze a graph in Tensorflow
[P] Activation Functions in Deep Learning (Sigmoid, ReLU, LReLU, PReLU, RReLU, ELU, Softmax)
[P] Colorizing black and white images using Deep Learning (Tensorflow)
[P] Informal review on Randomized Leaky ReLU (RReLU) in Tensorflow

Image Processing

[P] Multivariate Gaussian distribution clustering with Expectation Maximization in Python
[P] Otsu’s method, Python implementation
[P] Homography estimation explanation and python implementation
[M] Face Recognition using Eigenfaces
[M] Ellipse detection and space reduction
[M] Circle detection and space reduction
[M] High and low pass filters, the Einstein-Monroe picture
[M] Line detection (Cartesian, Polar and Space reduction)
[M] Thresholding and Subtracting
[M] Temporal median
[M] Laplacian and Marr-Hildreth operator
[M] Canny edge detector
[M] Gaussian blur
[M] Sobel Filter

Matlab

[M] How to take pictures from the webcam with Matlab

Neural Networks

[M] Multilayer Perceptron
[M] Perceptron

Reinforcement Learning

[M] Sarsa algorithm, a practical case
[M] First-visit Monte Carlo simulation solving a maze
[M] Simple goalkeeper simulation

Support Vector Machines (SVMs)

[M] SVM algorithm improvements
[M] SMO (Sequential Minimal Optimization) and Quadratic Programming explained
[M] SVM – Support Vector Machine explained with examples

[Image Processing] Temporal median

Definition

Despite the huge simplicity of temporal median (both theoretical and practical approaches), I considered it very interesting since it allows to remove undesired objects from a static background. This can be especially useful when someone wants to take a picture of a very crowded sightseeing or monument, although it consumes a very important amount of resources.

First we have to assume that the pictures were taken from the same spot, they have the same luminosity and the same size. These are quite strong constraints but can be achieved by using a tripod and a remote trigger. In my case, I used my smartphone which has a function that by making an intense noise (snap) it takes a picture.

The algorithm iterates over each coordinate and calculates the median of each pixel and each color channel from the different images. The value of each color channel is then mixed and located in that coordinates.

Let us say that we have 3 pictures with the same background and it has a single pixel located in different spots. When the iteration arrives to [5,8] it encounters a black dot in the first picture.

noise1 noise2 noise3

[latex]Channel_{red} = [0 \quad 237 \quad 237] \\
Channel_{green} = [0 \quad 28\quad 28] \\
Channel_{blue} = [0 \quad 36 \quad 36][/latex]

When median is calculated, the pixel will be:

[latex]Pixel_{5,8} = [237 \quad 28 \quad 36][/latex]

And therefore, the black pixel will disappear.

Other temporal operations use mode and average instead of median. In case of average, the result is a blended picture.

Results

4 images were processed (4208×2368) by an under-average laptop and it took 35 minutes to generate the result.

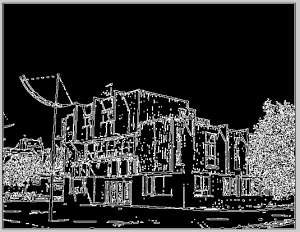
1
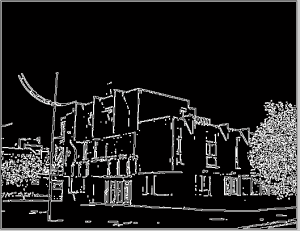
2
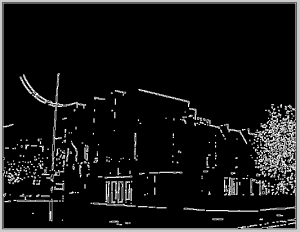
3
4
result

The code is provided in the Source code section.

References

1. M. Nixon and A. Aguado. 2008. “First order edge detection operators”, Feature Extraction & Image Processing.

[Second order edge detection operators] Laplacian and Marr-Hildreth operator

Laplacian

First order detection is based on the differentiation of intensity within the same region to detect changes whereas the second order gets zero when the rate of change is constant. Therefore, when a zero-crossing is found, the algorithm would have found an edge.

Laplacian operator is a template which implements this. By differentiating between two adjacent pixels (first order), the second order is approximated.
[latex]f”(x) \cong f'(x) – f'(x+1) \\
f”(x) \cong -f(x) + 2f(x+1) -f(x+2)[/latex]

Which can be translated into an horizontal (or vertical if transposed) as:

-1 2 1

And:

0 -1 0
-1 4 -1
0 -1 0
-1 -1 -1
-1 8 -1
-1 -1 -1

Marr-Hildreth operator

The Marr-Hildreth operator combines Gaussian filtering to smooth the image with Laplacian (LoG operator, Laplacian of Gauss). After the second differentiation of Gauss we have the corresponding formula to find the coefficients to the template to convolve the image with.

[latex size=”2″]\Delta^2g(x,y) = \frac{1}{\sigma^2}(\frac{(x^2+y^2)}{\sigma^2}-2)e^{\frac{-(x^2+y^2)}{2 \sigma^2}}[/latex]

This function, which can be approximated by a difference of Gaussians, is called Mexican hat wavelet because of its shape:

mexhat

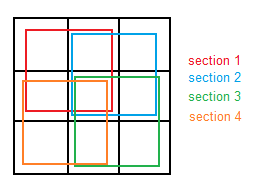
After the image is convolved with the generated template, we have do determine the zero-crossing points. There are many techniques to achieve this goal, but a much simpler solution is shown: first we divide a 3×3 window in 4 sections as in the following picture, all of them containing the pixel in the center. The average of each section is computed, and if the maximum value is positive and the minimum is negative, a zero-crossing is found and therefore the pixel in the center will be set as white (otherwise is marked as black). This has to be applied to the whole image.

sections

Results

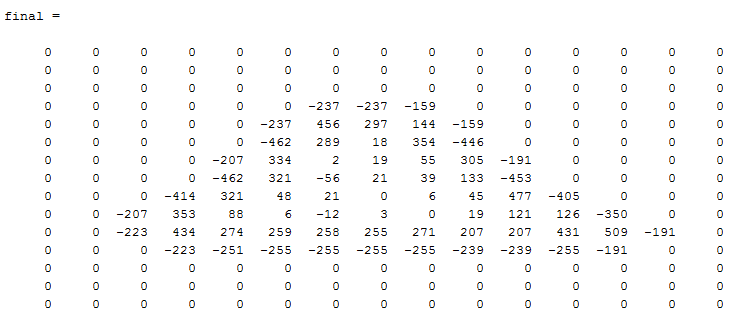
See how a simple figure changes after Laplacian is applied.

Laplacian

dd
Original input

im

finalimim
After Laplacian

finalim

In this case we would have to detect the zero-crossings to obtain the final result.

Marr-Hildreth

original
Original
size3
2nd derivative Gaussian: {size: 3, sigma: 0.7}
size5
2nd derivative Gaussian: {size: 5, sigma: 0.7}
size7
2nd derivative Gaussian: {size: 7, sigma: 0.7}
size9
2nd derivative Gaussian: {size: 9, sigma: 0.7}
size5sig5
2nd derivative Gaussian: {size: 5, sigma: 0.5}
size5sig6
2nd derivative Gaussian: {size: 5, sigma: 0.6}
size5sig8
2nd derivative Gaussian: {size: 5, sigma: 0.8}
size5sig9
2nd derivative Gaussian: {size: 5, sigma: 0.9}
size5sig10
2nd derivative Gaussian: {size: 5, sigma: 1}

The code is provided in the Source code section.

References

1. M. Nixon and A. Aguado. 2008. “First order edge detection operators”, Feature Extraction & Image Processing.

[Neural Networks] Multilayer Perceptron

Definition

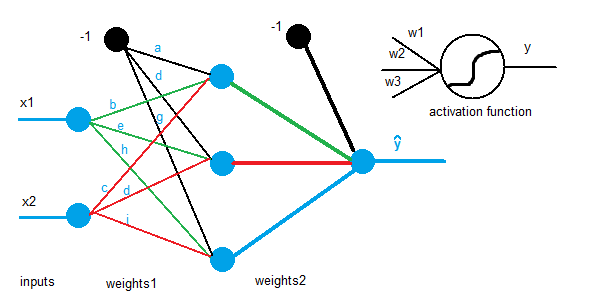
An MLP (Multilayer perceptron) is a feedforward neural network which consists of many perceptrons joined in many layers. The most basic MLP has 3 layers: one input layer, one output layer and one hidden layer, but it may have as many hidden layers as necessary. Each individual layer may contain a different number of neurons.

mlp

[latex]
W_1 = \begin{bmatrix}
a & b & c \\
d & e & f \\
g & h & i
\end{bmatrix}

\quad

W_2 = \begin{bmatrix}
.. & .. & .. & ..
\end{bmatrix}
[/latex]

Feedforward means that nodes have a direct connection such that nodes located in between are fed by the outputs of previous nodes and so on. This is very simple to program because it is basically as the perceptron: multiply weights (including bias nodes) by the input vector, give the result to the activation function, and the output will be the input of the next layer until the output layer is reached.

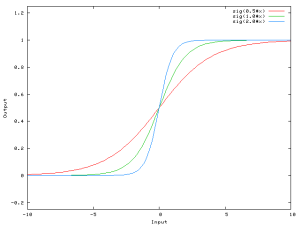
In the entry about the perceptron I used the step function as the activation function, but in MLP a variety of them can be used. Most of them are sigmoid (mathematical functions having an “S” shape) such as:

sig
tanh

The difference between these two sigmoids is that the hyperbolic tangent goes from -1 to 1 whereas the other goes from 0 to 1.

Sometimes linear functions are also needed for cases when neural networks are not used for classification but for extrapolation and any kind of prediction.

If the MLP misclassifies an input, it is necessary to back-propagate the error rate through the neural network in order to update old weights. Gradient descent through derivatives is used to correct the weights as much as possible. Derivatives show how the error varies depending on the weights to later apply the proper correction.

In perceptrons, the error function was basically [latex]t_i – y_i[/latex] (desired output minus system’s output) but in MLP the squared error function will be used instead [latex]J = \sum \frac{1}{2}(y-\widehat{y})^2[/latex]:

  • It has a sum because each element has its own error and it is necessary to sum them up.
  • It is squared because convex functions’ local and global minima are the same.
  • It has a [latex]\frac{1}{2}[/latex] to make it simpler when obtaining the derivative.

The following mathematical explanation regarding the formulas for the learning process is based on the 2x3x1 neural network depicted in the first picture of the entry, but before that, some terms need to be introduced to avoid misunderstandings:

[latex]X \to [/latex] Input matrix.
[latex]W_1 \to [/latex] Weights’ matrix that connects the input and hidden layers.
[latex]W_2 \to [/latex] Weights’ matrix that connects the hidden and output layers.
[latex]y \to [/latex] Desired output.
[latex]\eta \to [/latex] Learning rate.
[latex]z_2 = x*W_1 \to [/latex] Content of each node in the hidden layer (before activation).
[latex]a_2 = f(z_2) \to [/latex] Content of each node in the hidden layer (after activation).
[latex]z_3 = a_2*W_2 \to [/latex] Content of each node in the output layer (before activation).
[latex]\widehat{y} = f(z_3) \to [/latex] MLP output.
[latex]J = \sum \frac{1}{2}(y-\widehat{y})^2 \to [/latex] Squared error function.

First, let us calculate the update formula for [latex]W_2[/latex]. For this, it is necessary to calculate the derivative of the error with respect to [latex]W_2[/latex] to see how much the error varies depending on [latex]W_2[/latex].

[latex]\frac{\partial J}{\partial W_2} = \frac{\partial \sum \frac{1}{2} (y – \widehat{y})^2}{\partial W_2} = \sum \frac{\partial \frac{1}{2} (y – \widehat{y})^2}{\partial W_2}
[/latex]

By the sum rule in differentiation we can take the sum off the fraction, and from now on it is no longer needed since at the end we can sum each sample individually, so let us derive it.

[latex]\frac{1}{2} \cdot 2 \cdot (y – \widehat{y}) \cdot [ \frac{\partial y}{\partial W_2} – \frac{\partial \widehat{y}}{\partial W_2} ][/latex]

The derivative of y with respect to [latex]W_2[/latex] is 0 since y does not depend on [latex]W_2[/latex].

[latex]-1 (y – \widehat{y}) \cdot \frac{\partial \widehat{y}}{\partial W_2}[/latex]

By applying the chain rule:

[latex]-1 (y – \widehat{y}) \cdot \frac{\partial \widehat{y}}{\partial z_3} \cdot \frac{\partial z_3}{\partial W_2}[/latex]

Which finally:

[latex]-1 (y – \widehat{y}) f'(z_3) \cdot a_2 \to \delta_3[/latex]

In case of [latex]W_1[/latex] the procedure is very similar:

[latex]\frac{\partial J}{W_1} = [\text{same things…} ] = \delta_3 \cdot \frac{\partial z_3}{\partial W_1} = \delta_3 \cdot \frac{\partial z_3}{\partial a_2} \cdot \frac{\partial a_2}{\partial W_1} \\
= \delta_3 \cdot W_2 \cdot \frac{\partial a_2}{\partial z_2} \cdot \frac{\partial z_2}{\partial W_1} = \delta_3 \cdot W_2 \cdot f'(z_2) \cdot x[/latex]

Learning process (update rules):
[latex]W_1 = W_1 + \eta \frac{\partial J}{\partial W_1} \\
W_2 = W_2 + \eta \frac{\partial J}{\partial W_2}[/latex]

Results

The MLP I developed was able to correctly classify samples from its training set from 3 different classes. I have not written a word about overfitting because I will probably do that in a different entry with a good solution to overcome it, but this algorithm probably overfits and cannot classify other samples with the same good result.

Finally, I recorded the evolution of the error with two different learning rate to show that if [latex]\eta[/latex] is too big, it can escape from the minimum with an unknown result. In this case, it resulted absolutely good, but it is not always the case.

learningrate2

learningrate

Left: [latex]\eta = -0.2[/latex]. Right: [latex]\eta = -0.1[/latex]

The code is provided in the Source code section.

References

I strongly recommend the set of videos to which this one belongs to.

[Neural Networks] Perceptron

Definition

The perceptron is an algorithm for supervised learning of binary classifiers (linear classifier). This algorithm that dates back the late 60s is the most basic form of a neural network. It is important to realize that neural networks algorithms are inspired by neural networks, which does not mean that they entirely function as them.
Perceptrons only have one input and one output layer, so they are mathematically not very complex to understand.
im2

In terms of code, a perceptron is basically a vector of weights which multiplies an input vector and gives an output which is given to a transfer function to determine whether the input belongs to one class or another. Example:

[latex]input = [0.245 \quad 0.942 \quad 0.441] \\
weights = [0.1 \quad 0.32 \quad 0.63 \quad 0.04] \\
sum = -1*0.1 + 0.245*0.1 + 0.942*0.32 + 0.942*0.63 + 0.441*0.04 \\
class = activation(sum) \\[/latex]

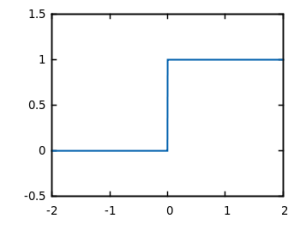
In case of perceptrons, activation function is a simple function which returns 1 if the whole sum is over 0, and return 0 otherwise. This is called step function, because it jumps from 0 to 1 when the input is over 0.

im1

step

Perceptrons have as many input and output neurons as needed, but they will always have an additional input neuron called bias. The reason why a bias is need is that because without it, the perceptron would not learn about a non-zero input and a zero output or vice versa. When the sum is computed, if all inputs are zero, the result will be therefore zero and the output will inevitably be zero as well. Hence, the weights cannot never learn because the result will always lead to zero.

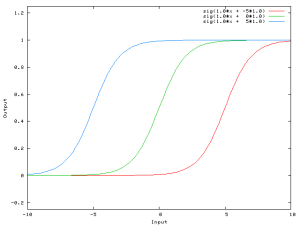
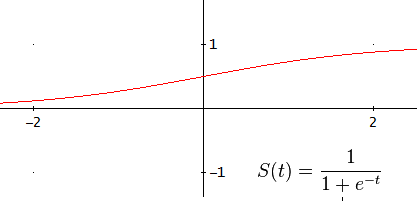
A more mathematical explanation is that despite that the steepness of the activation function can be modified easily without any bias, the bias is responsible for shifting along the X-axis the transfer function. In the following example, we have a one-to-one network and a sigmoid function, however, it can also be explained using the step transfer function described previously.

im3

When we have an [latex]x[/latex] dependent argument, the steepness of the sigmoid function can be modified. However, it cannot go anywhere further than 0 when the input is 0. For this, we need a bias.

im4

Now, the sigmoid curve can be shifted and we can, for example, get an output of 0 when the input is 2. Usually, the bias has a value of -1 or 1.

As a supervised learning algorithm, perceptron’s learning is based on a training set and a desired output for each input vector, and as a linear classifier, it can classify everything that is linearly separable. Now that we know how the perceptron works, it is time to see how it learns to classify data.

During the learning process, when the classifier receives input data and the classifier is able to classify it correctly, there is no need to make any adjustment. On the contrary, when there is a misclassified input, we need to update and readjust the weights applying the following formula:

[latex]w_i = w_i + \eta (t_i – y_i) x_i \quad[/latex]
(where w = weight, η = learning rate, t = target, y = output, x = input)

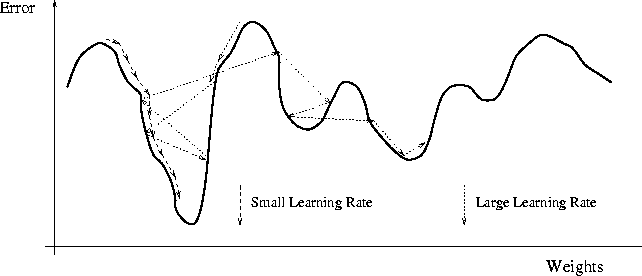
The learning rate plays a key role in perceptrons since it establishes the speed of perceptron’s learning. Before deciding which learning rate is more appropriate, note that a small learning rate may slow down considerably the speed of the learning algorithm and it will need more iterations and consequently more time and resources would be used whereas a big learning rate may make the algorithm jump from the minimum (as we can see in the picture) to climb the mountain that represents the error rate.

im5

Usually, the learning rate is between 0.1 and 0.4 since the weights are small numbers, usually initialized randomly between 0 and 1. Finally, before showing practical examples and Matlab code, it is worth talking about normalization. Normalization it is necessary to keep small weight values which means easy computation. Without normalizing, the algorithm will neither work most of the times. It makes no sense to mix high values (say, values around many thousands) with small values (around 10^-8 values). There is not a unique way to normalize a set of values, but the first one showed me better results.

[latex]y = \frac{x-mean(x)}{var(x)} \\
y = \frac{x-min(x)}{max(x)-min(x)}[/latex]

Example 1: AND

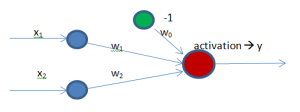
In this case we have a very simple diagram with only two neurons as input and one as output. Additionally, we have a bias connected to the output.

[latex]x_1[/latex] [latex]x_2[/latex] [latex]y[/latex]
0 0 0
0 1 0
1 0 0
1 1 1

im6

To solve this problem, we can iterate as many times as needed over our training set until we get no errors.

[latex]\displaystyle\sum_{i=0}^{N} w_i * x_i[/latex]

To learn, we apply the previous learning formula:

[latex]w_i = w_i + \eta (t_i – y_i) x_i[/latex]

After we finish iterating with no errors, we can build up the decision boundary using this formula:

[latex]y = \frac{-w_1*x + w_0}{w_2} \quad \to \quad w_2*y+w_1*x = w_0[/latex]

All elements at one side of the previous formula belong to a class whereas at the other side they belong to the other class.

im7

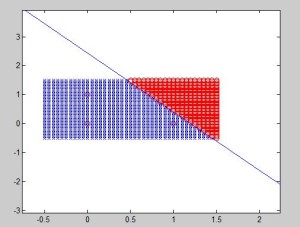
AND samples and the decision boundary were drawn. We could be sure about that the result will converge because the different classes are linearly separable (by a plane).

Example 2: XOR

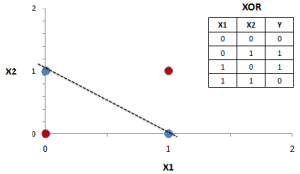
This is the best example to see how Perceptron fails at classifying XOR since it is not possible to separate both classes using only one line, in contrast with other logic functions. If we try to use the perceptron here, it will endlessly try to converge.

im8

This problem can be actually solved by perceptron if we add an additional output neuron. You can think about it trying to imagine this problem in 3 dimensions. In that case, it would be linearly separable.

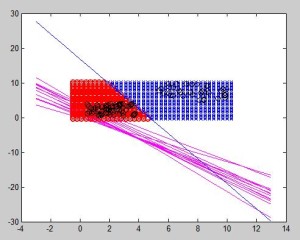
Example 3: Evolution of the decision boundary

Let us use pseudorandom data:

data = 0.5 + (4-0.5).*rand(66,2);
data = [data ones(66,1)];
data2 = 5 + (10-5).*rand(34,2);
data2 = [data2 zeros(34,1)];
data = [data;data2];

Adding a plot in each iteration:

x = -3:13;
y = (-weights(2)*x+weights(1))/weights(3);
plot(x,y,'m');

We can see the evolution of the decision boundary:

im9

In this example, we can see that boundaries are not located at the same distance since different amounts of samples have been used. Using the same amount, the distance between the closest elements would be the same.

Example 4: Distinguishing more than 2 classes

A naive attempt to simplify the amount of output neurons would be stating that 2 output neurons can classify up to 4 different classes since [latex]2^N = 4[/latex]. The 00 class would be class A, 01 class B, and so on. Nonetheless, the weights which go from input neurons to a certain output are able to classify just one element, so if 4 different classes are aimed to be distinguished, the same number of output neurons are needed.

im10

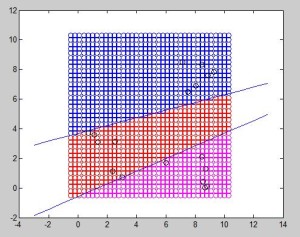
In the figure below, 3 different elements can be properly classified. The 2 output neurons perceptron can only distinguish one feature from another. In this example, 3 classes are differentiated: class B (blue), R and M, which respectively correspond to 01, 00 and 10 output.

im11

In this particular case, due to the position of each sample, it was possible to draw two straight lines through the whole training data. The next figure represents an example where unfortunately it is not possible to separate one feature from another. 6 samples from each of the 3 classes were chosen. In this case, the algorithm will endlessly try to converge without any valid result. In conclusion, for each feature to be distinguished, an output neuron is needed, but it still needs to be linearly separable.

im12

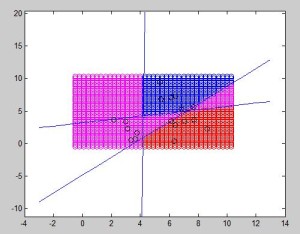
Using as many output neurons as you want is not a panacea. In practice, as we can see below it may work sometimes when a straight line can separate a class from the rest of them (and even in this case, you can see that it has an odd behavior in some magenta regions that need to be specially treated.

im13

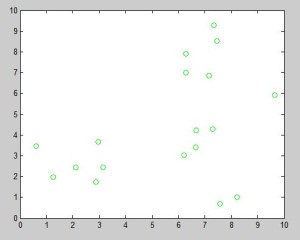
Finally, we have a case in which no line can be drawn to separate a class from the rest of them. It will always include a sample from other class. This algorithm definitely works better with few elements in each class because it will be able to linearly separate them, but this does not mean that it does a good work extrapolating new cases (for what the algorithm is suppose to be used).

Conclusions

Despite it seems that perceptrons can perform very poorly, they can be extremely powerful with datasets that undoubtedly are linearly separable since the algorithm is very simple and therefore they can be implemented in very basic systems such as an 8-bit board.

Additionally, perceptrons are academically important since their next evolution, the multilayer perceptron, is fairly used in many types of applications, from recognition/detection systems to control systems.

The code is provided in the Source code section.

[Edge detection] Canny edge detector

Process of Canny edge detection algorithm

There are three well differentiated steps:
1.-Apply Gaussian filter to remove noise
2.-Apply non-maximum suppression to remove useless edges
3.-Apply hysteresis to add well connected edges

1.-Apply Gaussian filter

Gaussian filter has been explained separately.

2.-Apply non-maximum suppression

The general idea of this process is that after applying a Gaussian filter to remove the noise, we need a tool to detect edge values such as Sobel filter. The value generated by doing the square root of both partial values squared will be denominated intensity from now on. The edges obtained by doing a Sobel filtering have different intensity, and the goal of non-maximum suppression is to keep the highest intensity edge pixels while removing the others, because usually a edge consist of a thin line of pixels rather than many of them.

When Sobel is used during this process, horizontal and vertical templates are:
[latex]
G_x = \begin{bmatrix}
-1 & 0 & +1 \\
-2 & 0 & +2 \\
-1 & 0 & +1
\end{bmatrix}

\quad \text{and} \quad

G_y = \begin{bmatrix}
+1 & +2 & +1 \\
0 & 0 & 0 \\
-1 & -2 & -1
\end{bmatrix}
[/latex]

The reason why I used a slightly different templates than in the Sobel filter entry is explained there.

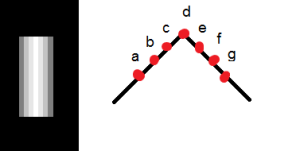
Have a look to this simple edge where intensities are represented using different colors (the whiter, the higher intensity), and imagine that intensity represents the height of each pixel so that we want to remove all except the one in the top of the ridge. We need to find the highest intensity element, and for this task we can look at the direction of each pixel to go upwards.

int1

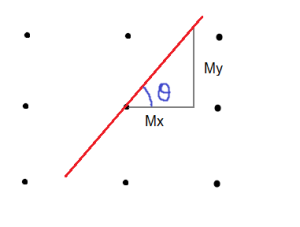
Directions can be obtained by the Gx and Gy values used for calculating the intensity, by simply:

[latex]
\theta = \arctan \frac{G_y}{G_x}
[/latex]

The direction is the vector orientation.

orientation

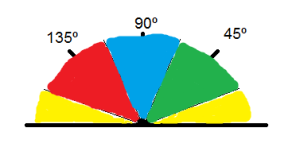
Depending on the angle, directions can be vertical, horizontal, diagonal-left, diagonal-right.

angles

Horizontal: 0 to 22.5 & 157.5 to 180 degrees
Vertical: 67.5 to 112.5 degrees
Diagonal-Left: 112.5 to 157.5
Diagonal-Right: 22.5 to 67.5

Now that for each pixel we have an intensity and direction, note that there can only be 2 more pixels surrounding our pixel in that direction, and we need to compare it with this two pixels. So if we have a pixel which has a vertical direction, it will be compared with the pixels above and below it (if no problem is encountered due to the borders). When comparing it, if a higher value is found, our pixel will be set to zero (black). Otherwise its value will be preserved.

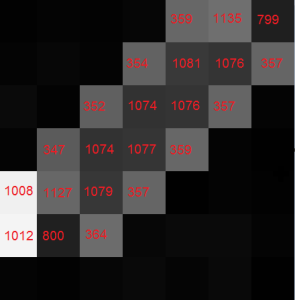
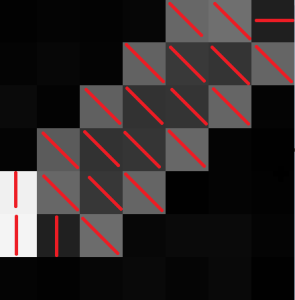
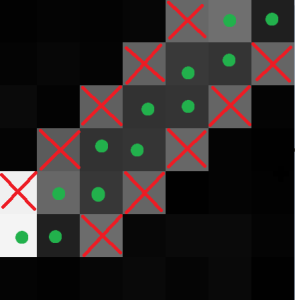
Let us say that I have a simple figure like this, to which I applied Sobel filter. Let us focus on a certain region (the right-bottom corner above the red line).

a1
Figure (20×20)
a2
After Sobel

On the first picture I wrote the intensity values whereas on the second one I depicted its orientation. In the last picture we can see which pixels were preserved and which were set to zero.

a31
Intensity
a32
Directions
ares
Result after comparing neighbors

3.-Apply hysteresis

Hysteresis’ process basically aims to threshold the whole image. Nonetheless, it does not use a single threshold, but two instead. We need to understand this as an attempt to extend the threshold giving to the algorithm a higher flexibility. For instance, I may find a pixel which is above the threshold and therefore considered as an edge, but right after it I may find another pixel which is part of the edge but its intensity is slightly below our threshold. That is the reason why the algorithm uses two thresholds.

The algorithm may be as:

Iterate over rows
Iterate over columns
If pixel is above threshold
Make this pixel white
For each surrounding pixel: if it is above the second threshold
Make surrounding pixel white
Else: make surrounding pixel black
Else: make this pixel black

Results (evolution of the process)

Note: Of course that these results may be better. You just need to keep playing with the parameters until you adjust it appropriately.

original
Original
gauss
Gauss: {kernel’s size: 9, sigma: 1}
sobel
Sobel: {kernel’s size: 3}
nonmaxsupr
Non-maximum suppression
hyst
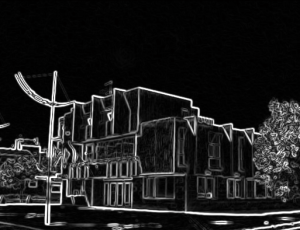
Hysteresis: {upperThreshold: 50, lowerThreshold: 30}

The code is provided in the Source code section.

References

1. M. Nixon and A. Aguado. 2008. “First order edge detection operators”, Feature Extraction & Image Processing.

[Image Processing] Gaussian blur

Definition

Gaussian blur is used in image processing to blur images. In most of the cases, this is done with the sole purpose of removing noise, but it is also necessary to take some care to its two different parameters. Depending on this two parameters, the result will vary. These two parameters are the size of the kernel and sigma.

In order to calculate the kernel that will be used to convolve the picture, we need to use the Gaussian formula for two dimensions, which is the following:

[latex]
G(x,y) = \frac{1}{2 \pi \sigma ^2} e ^{- \frac{x^2 + y^2}{2 \sigma ^2}}
[/latex]

Let us say that we want to generate a kernel of size 7 with [latex]\sigma = 0.84089642[/latex].
X and Y values are determined by the position of each element in the matrix.

positions

Finally, the values are:

0.00000067 0.00002292 0.00019117 0.00038771 0.00019117 0.00002292 0.00000067
0.00002292 0.00078634 0.00655965 0.01330373 0.00655965 0.00078633 0.00002292
0.00019117 0.00655965 0.05472157 0.11098164 0.05472157 0.00655965 0.00019117
0.00038771 0.01330373 0.11098164 0.22508352 0.11098164 0.01330373 0.00038771
0.00019117 0.00655965 0.05472157 0.11098164 0.05472157 0.00655965 0.00019117
0.00002292 0.00078634 0.00655965 0.01330373 0.00655965 0.00078633 0.00002292
0.00000067 0.00002292 0.00019117 0.00038771 0.00019117 0.00002292 0.00000067

The algorithm may be something like this:

Given kernel’s size and [latex]\sigma[/latex] generate a kernel
Iterate over rows
Iterate over columns
Convolve the windowed region with the generated kernel
Write that value on the output picture

Results

blur0

Original
gauss1

[latex]\sigma = 0.84089642[/latex], kernel’s size = 7
gauss2

[latex]\sigma = 1.5[/latex], kernel’s size = 7
gauss3

[latex]\sigma = 1.5[/latex], kernel’s size = 3

To make it easier, I used a black and white picture, but for color pictures we just need to do the same through the different channels.
It is possible to avoid the darkening of the images by normalizing output pixels during the process.

References

1. M. Nixon and A. Aguado. 2008. “First order edge detection operators”, Feature Extraction & Image Processing.
2. Wikipedia, http://en.wikipedia.org/wiki/Gaussian_blur

[Edge detection] Sobel Filter

History and Evolution

In order to detect edges, it seems obvious that we need to compare the intensity of adjacent pixels (vertical and horizontal). If the difference is high, we will probably have found an edge.

[latex]
E_x = P_{x,y} – P_{x+1,y} \quad \text{vertical} \\
E_y = P_{x,y} – P_{x,y+1} \quad \text{horizontal}
[/latex]

After we combine them:

[latex]
E_{x,y} = P_{x,y} – P_{x+1,y} + P_{x,y} – P_{x,y+1} \\
E_{x,y} = 2*P_{x,y} – P_{x,y+1} – P_{x+1,y}
[/latex]

Therefore, our coefficients are:

[latex]
K = \begin{bmatrix}
2 & -1\\
-1 & 0
\end{bmatrix}
[/latex]

Trough an Taylor series analysis (you can find the formulas in pages 119 and 120 of the referenced book) we can see that by differencing adjacent points we get an estimate of the first derivative at a point with error [latex]O(\Delta x)[/latex] which is the separation between points. This operation reveals that this error can be reduced by spacing the differenced points by one pixel (averaging tends to reduce noise). This is equivalent to computing the first order difference viewed in the previous formula at two adjacent points, as a new difference where:

[latex]
Exx_{x,y} = Ex_{x+1,y} + Ex_{x,y} \\
Exx_{x,y} = P_{x+1,y} – P_{x,y} + P_{x,y} – P_{x-1,y} \\
Exx_{x,y} = P_{x+1,y} – P_{x-1,y}
[/latex]

Hence:

[latex]
Mx = \begin{bmatrix}
1 & 0 & -1
\end{bmatrix}

\quad

My = \begin{bmatrix}
1 \\
0 \\
-1
\end{bmatrix}
[/latex]

Prewitt edge detection operator extended both templates by adding two additional rows (or columns). This is due to the fact that averaging reduce noise.

[latex]
Mx = \begin{bmatrix}
1 & 0 & -1 \\
1 & 0 & -1 \\
1 & 0 & -1
\end{bmatrix}

\quad

My = \begin{bmatrix}
1 & 1 & 1 \\
0 & 0 & 0 \\
-1 & -1 & -1
\end{bmatrix}
[/latex]

Finally, we can say that the Sobel edge detector is a simple modification of this.

Application

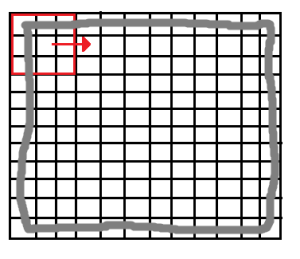
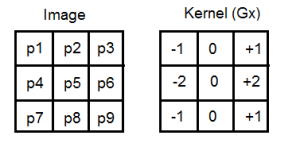
The application of this algorithm is as any other kernel based algorithm. We have two different kernels that need to be applied (convolved) to the image independently. This is done by shifting the kernel through the rows and columns as depicted, and multiplying by each element.

[latex]
G_x = \begin{bmatrix}
-1 & 0 & +1 \\
-2 & 0 & +2 \\
-1 & 0 & +1
\end{bmatrix}

\quad \text{and} \quad

G_y = \begin{bmatrix}
-1 & -2 & -1 \\
0 & 0 & 0 \\
+1 & +2 & +1
\end{bmatrix}
[/latex]

im1

The kernel’s size is odd (typically 3 or 5) so there is no problem fixing it and having a centered valued. During each iteration, we need to multiply each element of the windowed picture with each element of the kernel, and sum it together.

im2

[latex]
V_x = -1*p_1 + 0*p_2 + 1*p_3 + -2*p_4 + 0*p_5 + 2*p_6 -1*p_7 + 0*p_8 + 1*p_9
[/latex]

As I have said previously, during each iteration we need to compute Gx and Gy kernels, so we will end up with two values. The following operation is needed, and its result will be placed in the position of middle of the matrix (P5) in a different matrix which will have the final image:

[latex]
G = \sqrt{G_x^2 + G_y^2}
[/latex]

Note that because of this procedure, borders (2 images below marked with gray) will be lost. The larger is the kernel’s size, the more border will be lost. Nonetheless, this is not usually a problem since our goal is usually located at the center of the image.

In conclusion, the algorithm may be the following:

Iterate over rows
Iterate over columns
Convolve the windowed region with Gx
Convolve the windowed region with Gy
Solve square root
Write that value on the output picture

About Sobel templates

[latex]
G_x = \begin{bmatrix}
-1 & 0 & +1 \\
-2 & 0 & +2 \\
-1 & 0 & +1
\end{bmatrix}

\quad \text{and} \quad

G_y = \begin{bmatrix}
-1 & -2 & -1 \\
0 & 0 & 0 \\
+1 & +2 & +1
\end{bmatrix}
[/latex]

These templates are probably the most used that you can find in the literature about Sobel filter, but you can actually see that when using Sobel filter in Canny edge detector I used a slightly different ones.
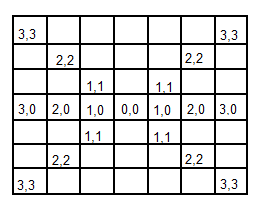
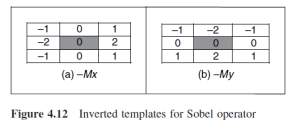
This is because Sobel edge direction data can be arranged in different ways without modifying the general idea of the filter. Therefore, depending on the template’s orientation, points will have different directions, as we can see in the following pictures extracted from the book I used.

pic1

pic2

Results

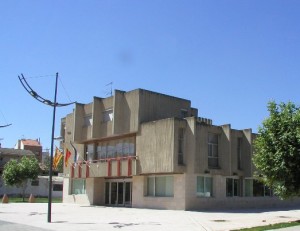
utebo
Original
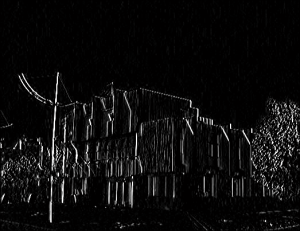
sobelx
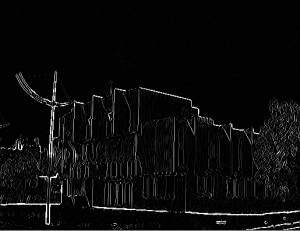
Sobel Y-axis
sobely
Sobel X-axis
sobel
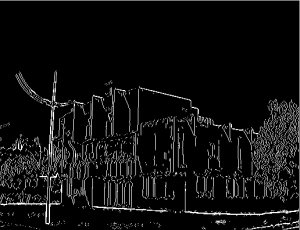
Sobel (combined)

The code is provided in the Source code section.

References

1. M. Nixon and A. Aguado. 2008. “First order edge detection operators”, Feature Extraction & Image Processing.