Homographies are transformations of images from one planar surface to another (image registration). Homographies are used for tasks such as camera calibrations, 3D reconstruction, image rectifications. There are multiple methods to calculate an homography and this post explains one of the simplest.
Given a point in a 3D space [latex]x=(x_1,y_1,1)[/latex] and a matrix H, the resulting multiplication will return the new location of that point [latex]x’ = (x_2,y_2,1)[/latex] such that:
[latex]x’ = Hx[/latex]
Due to the dimensions of [latex]x[/latex] and [latex]x'[/latex] we know that H will be a 3×3 matrix but even if there are 9 elements in the matrix, we will have just 8 degrees of freedom. In this Powerpoint presentation [1] we can intuitively see where does it come from.
So we have that:
[latex]
\begin{bmatrix}
u \\
v \\
1
\end{bmatrix}
=
\begin{bmatrix}
h_1 & h_2 & h_3 \\
h_4 & h_5 & h_6 \\
h_7 & h_8 & h_9
\end{bmatrix}
\begin{bmatrix}
x \\
y \\
1
\end{bmatrix}
[/latex]
Where [latex]u[/latex] and [latex]v[/latex] are the new coordinates. Therefore, we have:
[latex]
\\
u = x h_1 + y h_2 + h_3 \\
v = x h_4 + y h_5 + h_6 \\
1 = x h_7 + y h_8 + h_9 \\
[/latex]
So for each point we have:
[latex]
\\
x h_1 + y h_2 + h_3 – u (x h_7 + y h_8 + h_9) = 0 \\
x h_4 + y h_5 + h_6 – v (x h_7 + y h_8 + h_9) = 0 \\
A_i =
\begin{bmatrix}
x & y & 1 & 0 & 0 & 0 & -ux & -vy & -u \\
0 & 0 & 0 & x & y & 1 & -ux & -vy & -u
\end{bmatrix}
[/latex]
Since we have 8 degrees of freedom, we need at least 4 points to obtain H (each point contributes with two new variables to the formula, x and y). We just need to stack [latex]A_1, A_2, A_3, A_4[/latex] to have a 8×9 matrix that we will call A. We are interested in solving the following equation avoiding the trivial solution h=0
[latex]
Ah=0;
\begin{bmatrix}
x_1 & y_1 & 1 & 0 & 0 & 0 & -u_1 x_1 & -v_1 y_1 & -u_1 \\
0 & 0 & 0 & x_1 & y_1 & 1 & -u_1 x_1 & -v_1 y_1 & -u_1 \\
& & & & \cdots
\end{bmatrix}
\begin{bmatrix}
h1 \\ h2 \\ h3 \\ \vdots
\end{bmatrix}
= 0
[/latex]
We will solve this as a least squares problem using singular value decomposition (SVD)
Least squares and SVD
This method (explained very clearly in [2]) is used when we want to approximate a function given different observations. For instance, we have that:
[latex]
\\
c + d x_1 = y_1 \\
c + d x_2 = y_2 \\
c + d x_3 = y_3
[/latex]
If there were no errors those equations would be true, but since our measurements might have noise we want to minimize that errors by minimizing:
[latex]
(c + d x_1 – y_1)^2 + (c + d x_2 – y_2)^2 + (c + d x_3 – y_3)^2
[/latex]
In general, for systems like [latex]Ax=b[/latex] we want to minimize [latex]|| Ax-b ||^2[/latex]
We will use SVD in our matrix A:
[latex]
[U,S,V] = SVD(A)
[/latex]
V are the eigenvectors of [latex]A^T A[/latex]. The solution is therefore the last eigenvector because its eigenvalue (diagonal matrix D) will be zero or close to zero in case of noise. More intuitively, imagine that the largest eigenvectors will depict the largest variance across the data, and we are interested in minimizing, so the eigenvector should have a small eigenvalue.
When performing an homography, the resulting image will probably have different dimensions from the original one since it might be stretched, rotated, and so on. This will result in having many “empty pixels” that must be filled by performing an interpolation.
One of the nicest properties of the homography is that H has an inverse, which means that we can map all points back to the origin by multiplying them to the inverse of H. In order to fill an empty point we will multiply their coordinates by [latex]H^{-1}[/latex] to get the original coordinates, which will be floating point numbers. Those “original coordinates” must be interpolated (for instance, you can round them) to get the closest pixel (nearest neighbor) and put it in the empty pixel.
Example
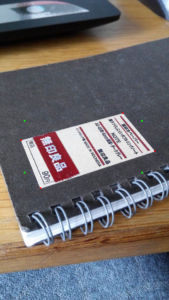
In the following example the label of this small notebook will be placed horizontally. For this, the location of the 4 pixels corresponding to the four corners is used, and a new location drawing a rectangle is calculated as well. The red dots correspond to the points we want to transform and the green dots their target location.
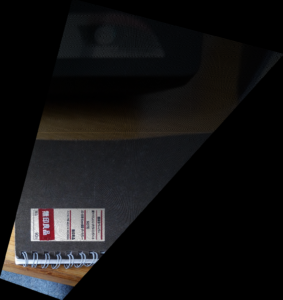
This first approximation is obtained by calculating the new location of each pixel. However, it will leave plenty of empty pixels that can be interpolated after the inverse matrix of the homography transformation matrix is calculated.
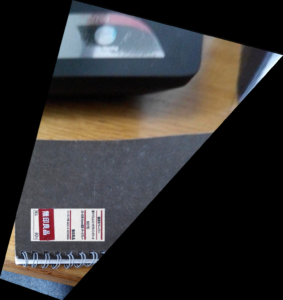
After the interpolation, the final result will not contain any empty pixel.
The code is provided in the Source code section.
References
1. https://courses.cs.washington.edu/courses/csep576/11sp/pdf/Transformations.pdf (Accessed on 8-8-2017)
2. http://www.sci.utah.edu/~gerig/CS6640-F2012/Materials/pseudoinverse-cis61009sl10.pdf (Accessed on 8-8-2017)


