Multivariate Gaussian distribution clustering with Expectation Maximization in Python

Expectation Maximization (EM) is a classical algorithm in ML for data clustering. Its theoretical background is based on Bayes theorem and although it’s quite straightforward to follow it might be a bit confusing to implement it in more than 1 dimension.

If you want to understand more about EM I recommend you to check out this and this videos.

EM in a nutshell:

  1. Randomly initialize a mean and variance per class.
  2. Calculate the probability of each data point to belong to those distributions.
  3. Calculate the mean and variance based on those probabilities.
  4. Go to 2. and repeat until convergence.

In the Figure above we can see the initial clusters (top-left), and how the classification is changing in different iterations.

This method considerably relies on the mean and variance initialization. An unlucky initialization will provide with a deficient segmentation.

The code is provided in the Source code section.

Otsu’s method, Python implementation

Otsu’s method is a very old but still used adaptive segmentation algorithm due to its simplicity.

Segmenting an image by setting a threshold is probably the easiest possible approach, but that threshold needs to be established somehow. Otsu’s method looks at the histogram and tries to minimize the within-class variance. In other words, it tries to find a threshold such that the variance of the resulting both classes in the Gaussian distributions is as small as possible.

In the picture above we can guess that a good threshold might be somewhere in between those two Gaussian-like distributions. If you want to learn more about Otsu’s method, check this video.

The code is provided in the Source code section.

Introduction to Activation Maximization and implementation in Tensorflow

Introduction

The goal of this entry is to learn about activation maximization and to prove two basic well-known facts about Deep Learning.

  1. The way a NN learns the representation of something does not neet to be in a significant way for humans. In fact, most of the times it’s not.
  2. The found minima depends (among other factors) on the initial state.

It might be interesting to have a look at the representation the NN creates of a object (in case of classification) in order to understand why it is [not] performing well. To make it simple, I used MNIST dataset to create a NN capable of recognizing 0-9 digits. If we think of how does a 1 need to look like so that a person can understand it is a 1, we may think of it as a vertical straight line that can be a bit tilt.

Activation Maximization

Activation maximization, as the name indicates, aims to maximize the activation of certain neurons. Imagine you are training your model with a single image several times. Training is changing the weights accordingly to achieve the lowest loss possible, so the input and the desired output will be constant whereas the weights will be modified iteratively until we reach a minima (or until we decide to stop training). In Activation Maximization, we will keep the weights and the desired output constant and we will modify the input such that it maximizes certain neurons.

I coded the following simple network in Tensorflow, trained it on MNIST dataset and achieved a 0.984 accuracy:

  1. 2DConv [3,3,1,32]
  2. 2DConv [3,3,32,64]
  3. Max pooling
  4. Reshape to 12*12*64 = 9216
  5. Dense 1,9216
  6. Dense 9216,10

After this, the code was changed to only modify the network’s input and iterate 10 times (Note: the input did not significantly improved much after 10 iterations). The achieved result varies depending on the initial values of the input, as shown in the Table below.

Table 1: The initial values to generate those images were the following: (first row, from left to right) ones, 0.5, (second row, from left to right) zeros and random

Although it may be difficult to see we can quickly understand that depending on the initial values our results will be significantly different, thus it is important to think and try different configurations. In spite of the results obtained from the randomly generated initial input, the other three present a similar structure: the center of the images have large values (white) and they are surrounded by negative values. You may have expected to reach results in which you can clearly see an horizontal white line surrounded by black pixels, but this trained network didn’t need that to distinguish between 1 and other classes. As we can see, the values in the center are the most significant.

We may also see something similar in the random example. In this case, we can visualize the variation of the pixels comparing the initial with the final state.

It is indeed hard to see. However, if you input the values obtained to generate this image into the classifier, you will get that the network classifies it as 1 with a 0.99999 confidence. For classifying a one, the network might not have to learn much about it.

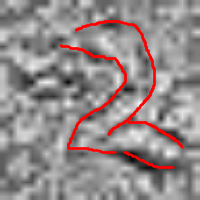
For this reason, I calculated the maximum variability between the 10 classes pixel-wise among the whole dataset (standard deviation) and concluded that the samples of the number 2 are very different among them. Let us try to see what would happen if we repeat the same experiment from a random initial state to maximize the activation function for a 2.

In this case, it is easier to see the number we want to classify. Again, using these values will provide with a right classification with a confidence of over 0.9999. In order to prove that the outer pixels (the first and last horizontal and vertical rows of pixels) are irrelevant, we can overwrite the values with 0 and still get a confidence of around 0.9989.

The code is provided in the Source code section.

Gradients in Tensorflow

The chain rule in Tensorflow

Manipulating any type of neural network involves dealing with the backpropagation algorithm and thus it is key to understand concepts such as derivatives, chain rule, gradients, etc. It is often important to not only theoretically understand them but also being able to play around with them, and that is the goal of this post. Most of the information presented has been collected from different posts from stackoverflow.

There are three types of differentiation:

  • Numerical: it uses the definition of the derivative (lim) to approximate the result.
  • Symbolic: manipulation of mathematical expressions (the one we learn in high school).
  • Automatic: repeatedly using the chain rule to break down the expression and use simple rules to obtain the result.

As the author of the answer (Salvador Dali) in stackoverflow points out, symbolic and automatic differentiation look similar but they are different.

Tensorflow uses reverse mode automatic differentiation.

As mentioned above, Automatic differentiation uses the chain rule so there are two possible ways to apply it: from inside to outside (forward mode) and vice versa (reverse mode). In the Automatic differentiation Wikipedia page there are a couple of step-by-step examples of forward and reverse mode quite easy to follow. The reverse mode is a bit harder to see probably because of the notation introduced by the Wikipedia but someone made a simple decomposition easier to understand.

Gradients

Gradients of common mathematical operations are included in Tensorflow so they can be directly applied during the reverse mode automatic differentiation process. In fact, if you want to implement a new operation it has to inherit from Decop and its gradient has to be “registered” (RegisterGradient). For example, this is how the derivative of [latex s=2]f(x)=sin(x)[/latex] looks like (python/ops/math_grad.py):

@ops.RegisterGradient("Sin")
def _SinGrad(op, grad):
  """Returns grad * cos(x)."""
  x = op.inputs[0]
  with ops.control_dependencies([grad]):
    x = math_ops.conj(x)
    return grad * math_ops.cos(x)

The function tf.gradients is used by any optimizer because they all inherit from the class Optimizer (python/training/optimizer.py). tf.gradients is not commonly used directly but it is implicitly used when calling the function minimize as:

train_step = tf.train.GradientDescentOptimizer(learning_rate=0.01).minimize(loss)

More specifically, “minimize” function has two tasks:

  1. Calculate gradients
  2. Apply gradients

We can thus apply those operations, or even break down calculate_gradients to use tf.gradients. Here there are three alternatives when minimizing a loss function:

with tf.variable_scope("optimization") as scope:
  optimizer = tf.train.GradientDescentOptimizer(learning_rate=0.01)
  # Option 1:
  train_step = optimizer.minimize(self.loss)
  # Option 2:
  grads = optimizer.compute_gradients(self.loss,var_list=tf.trainable_variables())
  train_step = optimizer.apply_gradients(grads)
  # Option 3:
  grads = tf.gradients(loss,tf.trainable_variables())
  grads_and_vars = list(zip(grads,tf.trainable_variables()))
  train_step = optimizer.apply_gradients(grads_and_vars)

This decomposition of the function minimize can be useful in some cases. For instance, you may want to process or keep track of the gradients to understand the Graph computations or you may want to calculate the gradients with respect to only some variables and not all of them.

Simple tf.gradients example

We have the function [latex s=2]z = f(x,y) = 2x-y[/latex] and we want to calculate both of its partial derivatives [latex s=2]\frac{\partial z}{\partial x} = 2[/latex] and [latex s=2]\frac{\partial z}{\partial y} = -1[/latex].

import tensorflow as tf

x = tf.Variable(1)
y = tf.Variable(2)
z = tf.subtract(2*x, y)
grad = tf.gradients(z, [x, y])

sess = tf.Session()
sess.run(tf.global_variables_initializer())

res = sess.run(grad)
print(res) # [2, -1]

In the previous example we could not see that after the derivatives are calculated, tf.gradients also substitutes each variable by its value and performs the corresponding calculations. Another example: [latex s=2]z = f(x,y) = sin(x)-y^3[/latex]. [latex s=2]\frac{\partial z}{\partial x} = cos(x)[/latex], [latex s=2]\frac{\partial z}{\partial y} = -3y^2[/latex]

import tensorflow as tf

x = tf.Variable(3.)
y = tf.Variable(5.)

z = tf.subtract(tf.sin(x), tf.pow(y,3))
grad = tf.gradients(z, [x, y])
#upd = inp - tf.multiply(grad,0.01)
sess = tf.Session()
sess.run(tf.global_variables_initializer())

res = sess.run(grad)
print(res) # [-0.9899925, -75.0] <-> [cos(3), -3*5*5]

Dropout explained and implementation in Tensorflow

Dropout

Dropout [1] is an incredibly popular method to combat overfitting in neural networks. The idea behind Dropout is to approximate an exponential number of models to combine them and predict the output. In machine learning it has been proven the good performance of combining different models to tackle a problem (i.e. AdaBoost), or combining models trained in different parts of the dataset. However, when it comes to deep learning, this becomes too expensive, and Dropout is a technique to approximate this.
dropout

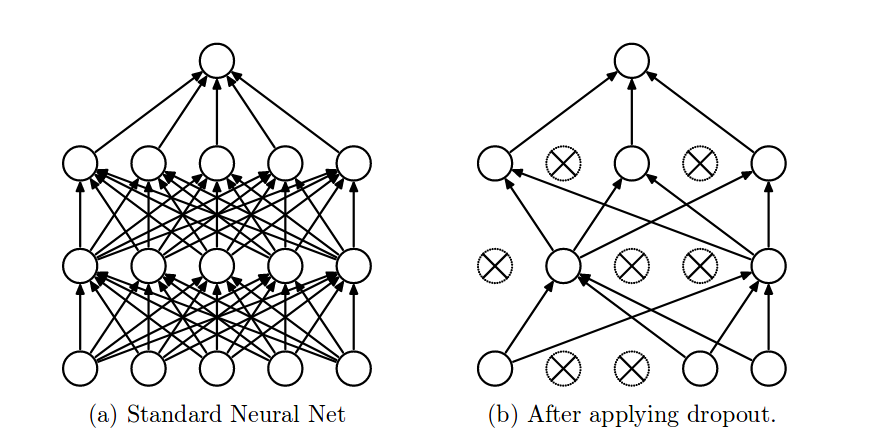
Dropout can be easily implemented by randomly disconnecting some neurons of the network, resulting in what is called a “thinned” network. Thus, if the model has [latex]n[/latex] neurons, there are [latex]2^n[/latex] potential models. Each of them might be trained once or few times, or even not trained at all. Generating one of these random models is done batch-wise so in every batch there will be a new dropout mask (to disconnect the corresponding weights) generated. At train time, each neuron has a probably [latex]p[/latex] of being disconnected. For instance, if [latex]p=0.5[/latex] (recommended configuration, except for the input layer which is recommended to have [latex]p=0.8[/latex]) and we have 200 neurons, the first batch might encounter 90 activated neurons, the second batch might encounter 103 activated neurons, etc.

At test time, all neurons will multiply [latex]p[/latex].
dropoutform

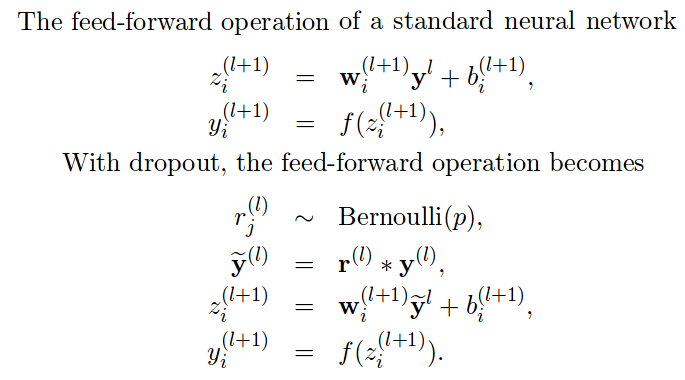
In the image above we can see a simple implementation of a standard feedforward pass: weights multiply inputs, add bias, and pass it to the activation function. The second set of formulas describe how it would look like if we add dropout:

  1. Generate a dropout mask: Bernoulli random variables (i.e. 1.0*(np.random.random((size))>p)
  2. Apply the mask to the inputs disconnecting some neurons.
  3. Use this new layer to multiply weights and add bias
  4. Finally use the activation function.

All the weights are shared across the potential exponential number of networks, and during backpropagation, only the weights of the “thinned network” will be updated.

How is it implemented in Tensorflow?

In Tensorflow it is implemented in a different way that seems to be equivalent. Let’s have a look at the following example. According to the paper:

Let our neurons be: [latex][1,2,3,4,5,6,7,8][/latex] with [latex]p=0.5[/latex].
At train time, half of the neurons would be randomly disconnected, leading to [latex][1,0,0,4,5,0,7,0][/latex]
At test time, we would have multiplied the whole matrix by p, leading to [latex]0.5*[1,2,3,4,5,6,7,8][/latex]

In other words, we downgrade the outcome at testing time. In contrast, in Tensorflow, we do it the other way around. We increase the values at training time by [latex]1/prob[/latex]. Following our example:

Let our neurons be: [latex][1,2,3,4,5,6,7,8][/latex] with [latex]p=0.5[/latex].
At train time, half of the neurons are randomly disconnected, leading to [latex]1/0.5*[1,0,0,4,5,0,7,0] = [2,0,0,8,5,0,14,0][/latex]
At test time, we would use [latex]p=1[/latex], leading to [latex]1/1*[1,2,3,4,5,6,7,8][/latex]

In other words, at testing time we treat it as a normal neural network without dropout, and at training time we upscale the values by [latex]1/prob[/latex].

The reason why the values are upscale is to preserve the total sum (approx.).

[latex]sum([1,2,3,4,5,6,7,8]) = 36[/latex]
[latex]sum(1/0.5 * [1,0,0,4,5,0,7,0]) = 29[/latex]

This makes sense because if our layer produces certain output, we want to keep it approximately the same regardless of any method we are using to combat overfitting.

Dropout in Tensorflow

Adding a dropout layer in Tensorflow is really easy.

...
W = tf.get_variable("W",shape=[512,128],initializer=init)
b = tf.get_variable("b",initializer=tf.zeros([128]))

dropped = tf.nn.dropout(prev_layer,keep_prob=current_keep_prob)

dense = tf.matmul(dropped,W)+b
act = tf.nn.relu(dense)
...

Where current_keep_prob will be [latex]p[/latex] during training time and 1 during inference/testing time.

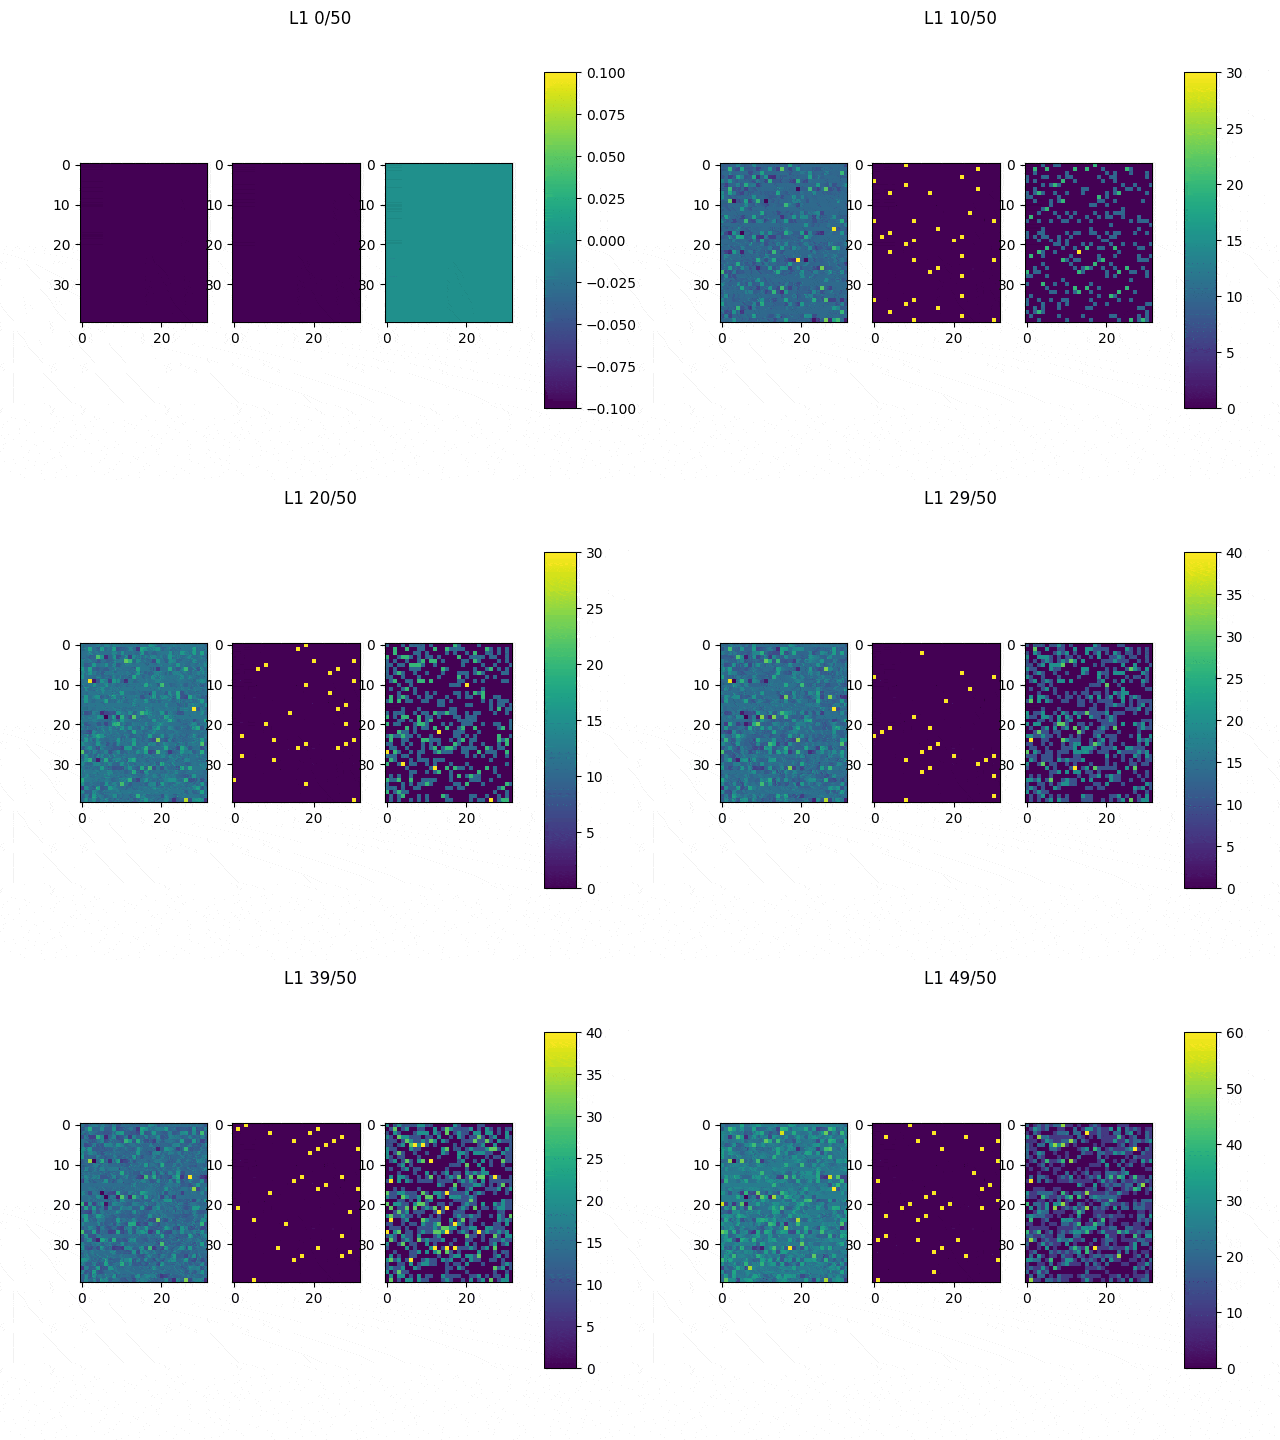
As I mentioned before, only those weights that were successfully masked (without the ones corresponding to the dropped out neurons) will be updated. If I have 100 neurons and [latex]p=0.5[/latex], half of the weights are expected to be updated. In the gif below we can see the evolution of 3 different plots: the first shows how the weights are being updated, the second shows which weights are being updated and the third is a cumulative sum of the second.
compressed_dropout

Optimizers comparison with and without Dropout

Due to the nature of AdamOptimizer, it does not follow this rule of updating only the weights belonging to the “thinned” network, so I found interesting to compare the performance of several optimizers in a simple neural network.

Test
Goal: To perform a first step to check the performance between Adam, Adadelta, Adagrad and Gradient Descent across different learning rates (1000 learning rates between 1e-6 to 1e-1).
Dataset: EMNIST (47 classes).
Batch size: 8.
Epochs: 1.
Network: conv2d (3,3,1,32), conv2d (3,3,32,64), max pooling (2,2), reshape (12*12*64), dense (12*12*64,128), dense (128,47).
Weights initialization: he_uniform. Bias initialization: zeros.
Activation layers: ReLU (and softmax at the end of the network).
Cost function: cross entropy.
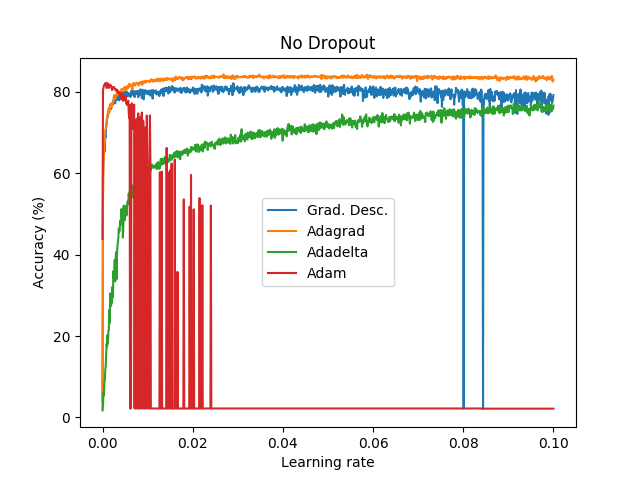
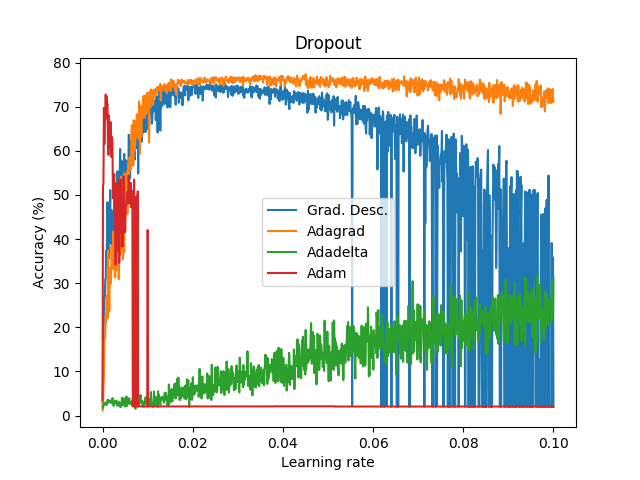
These graph does not show the actual performance of dropout under each optimizer since I only tested a bunch of learning rates without properly examine and focus where it seems to provide good results. In addition, it is not fair to compare on the same learning rates dropout vs non-dropout. Instead, this shows how a first step looks like .

References

1. NNitish Srivastava, Geoffrey Hinton, Alex Krizhevsky, Ilya Sutskever, Ruslan Salakhutdinov. 2014. “Dropout: A simple way to prevent neural networks from overfitting”
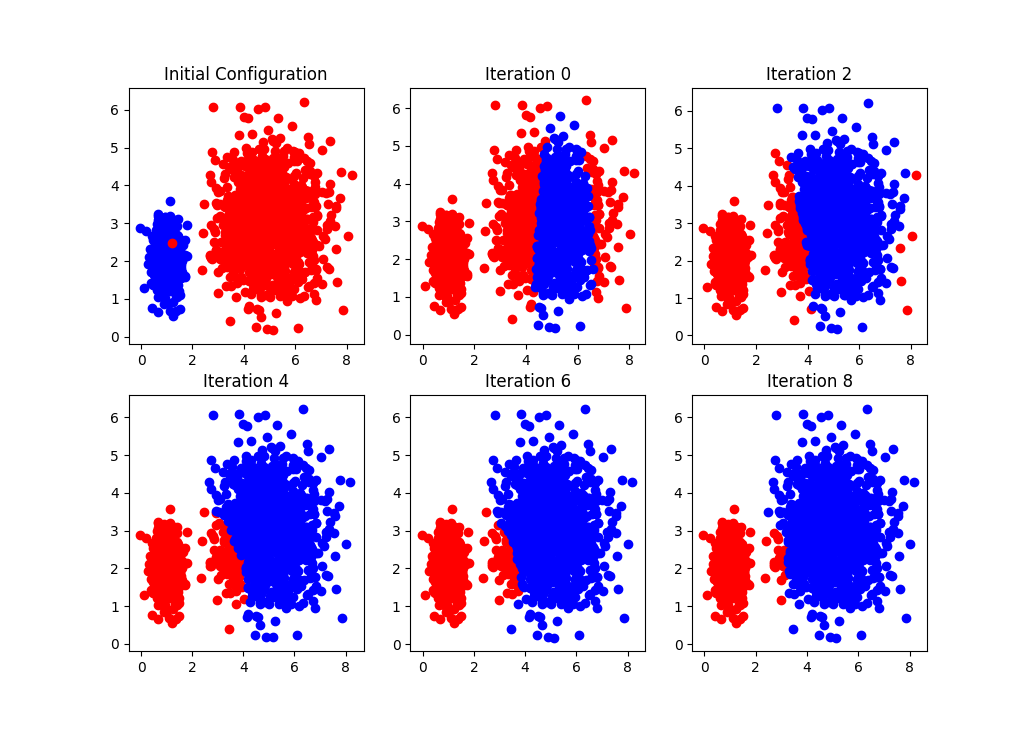
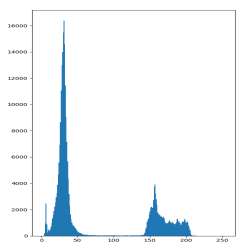
Image style transfer using convolutional neural networks – Tensorflow implementation

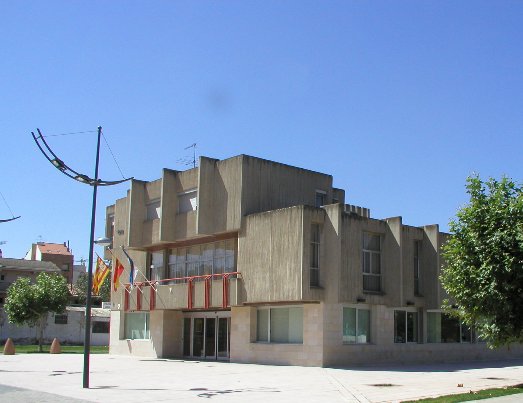
Recently I recorded a video explaining in a very simple way how style transfer works in a convolutional neural network (VGG16) based on the incredibly well-written paper by Gatys et al [1]. I also implemented it in an extremely concise and simple way (around than 150 lines with comments).

Original Image

utebo

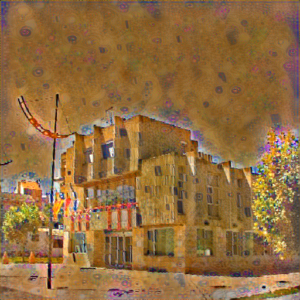
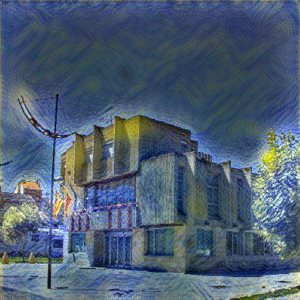
Combinations

scream result1
gustav result2
gogh result3

The code is provided in the Source code section.

References

1. Gatys LA, Ecker AS and Bethge M. 2016. Image Style Transfer Using Convolutional Neural Network.

[Now Reading]: U-Net Convolutional Networks for Biomedical Image Segmentation

Title: U-Net Convolutional Networks for Biomedical Image Segmentation
Authors: Olaf Ronneberger, Philipp Fischer, Thomas Brox
Link: https://arxiv.org/abs/1505.04597

Quick Summary:
Screenshot (22)

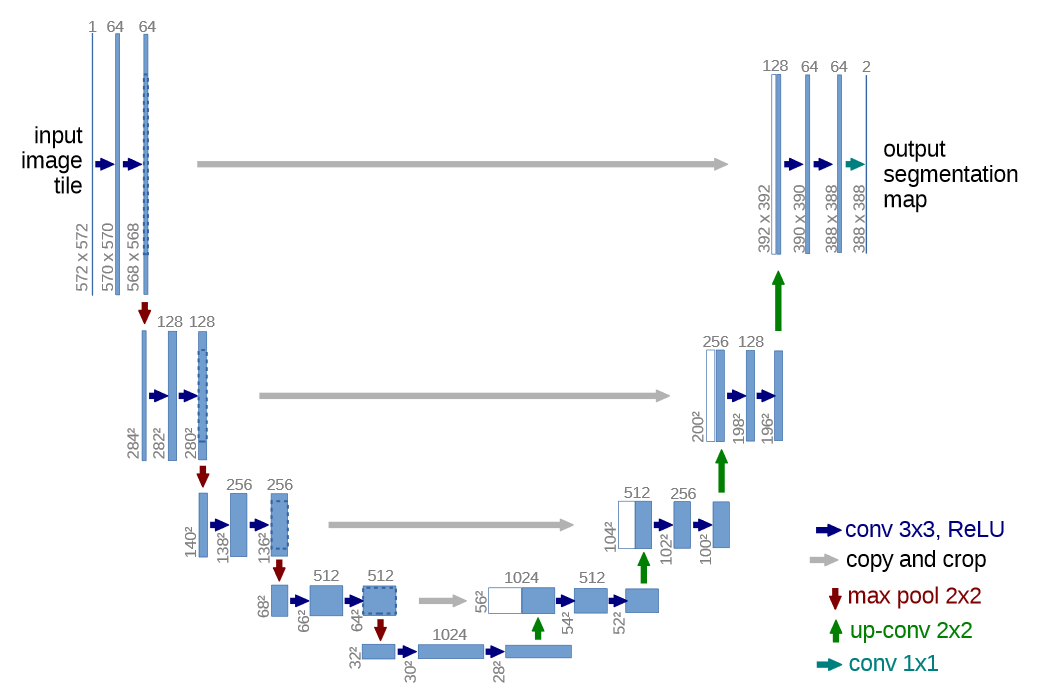
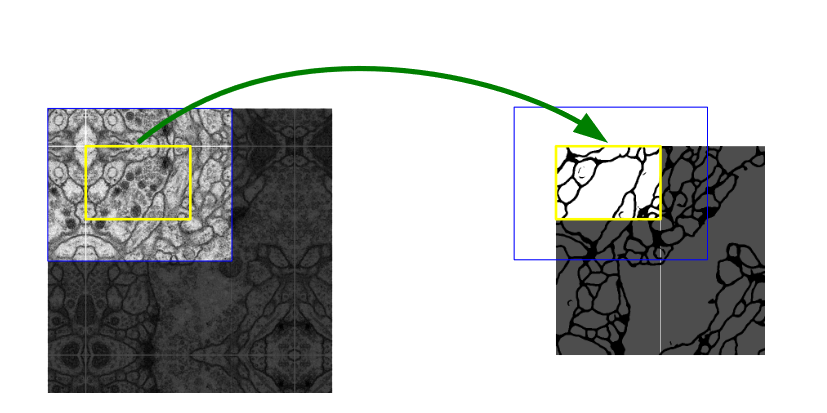
One of the interesting things about the paper is the architecture used. They share they weights of the “contracting path” in the “expansive path”, and since the sizes are different, they are forced to crop them (blue dots in the layers).

Screenshot (23)

One of the challenges faced by the authors were the separation between different cells that belong to the same class. For this, they propose using a weighted loss where those separations have a large weight in the loss function.

Training uses a high momentum (0.99) because they don’t have many training samples. Thus, a large number of the previously seen training samples determine the update of the current optimization step. In addition, they perform data augmentation for the model to be rotation and shift invariant, and robust to deformations and gray value variations.

[Now Reading] Confidence Estimation in Deep Neural Networks via Density Modelling

Title: Confidence Estimation in Deep Neural Networks via Density Modelling
Authors: Akshayvarun Subramanya, Suraj Srinivas, R.Venkatesh Babu
Link: https://arxiv.org/abs/1707.07013

Quick Summary:
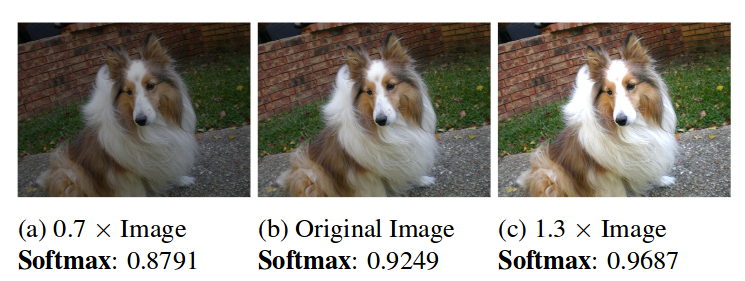
Confidence level via traditional softmax activation function does not produce very good estimates. Given an input, if we increase its values (for instance, x1.3), the confidence of the winner class will consequently increase.

cropped1

The authors propose to estimate the confidence level based on density modelling. Given our inputs [latex]X[/latex] and the pre-softmax result [latex]z[/latex], and since there is one-to-one mapping from [latex]X[/latex] to [latex]z[/latex], we are interested in calculate [latex]P(y_i | X)[/latex] (probability of each class given the input X).

[latex]P(y_i | z) = \frac{P(z | y_i) P(y_i)}{\sum_{j=1}^N P(z | y_i) P(y_i)}[/latex]

[latex]P(y_i)[/latex]: probability of having that class.
[latex]P(X | y_i) = N(z | \mu_i, \sigma_i)[/latex]: the probability is the value [latex]z[/latex] of the normal distribution of [latex]\mu_i, \sigma_i[/latex]. The mean and variance are learn during the training and the density function is generated.

A more graphical and probably easy-to-understand way to see this is to think that we have a vector [latex]z[/latex] of size N (number of classes). To get the confidence level we would normally use a softmax function, but instead, the authors calculate a density model to calculate later how likely is that given a specific [latex]z[/latex], we predict [latex]y_i[/latex].

[Now Reading] On Calibration of Modern Neural Networks

Title: On Calibration of Modern Neural Networks
Authors: Chuan Guo, Geoff Pleiss, Yu Sun, Kilian Q. Weinberger
Link: https://arxiv.org/abs/1706.04599

Quick Summary:
A model is considered calibrated if their confidence levels (probabilities) and their predictions are correlated. For instance, if we predict Y with a confidence level of 0.7, we expect that it will be right the 70% of the times. In contrast, if our model have predictions whose confidence is around 0.9 but they are right only about half of the times (50%) the model is not well calibrated.

The authors describe that recent models are often non-calibrated. The provide some measures to calculate the miscalibration (Expected Calibration Error and Maximum Calibration Error). ECE can be useful in a general application whereas MCE is useful in high-risk applications where we need to be very confident to perform an action (diagnosis prediction). Miscalibration often comes in models with high capacities (deep and wide) and lack of regularization.

There is no correlation between miscalibration and accuracy. They argue that a model can overfit its loss while getting better at predictions. One of their conclusions is “the network learns better classification accuracy at the expense of well-modeled probabilities”.

The authors mention some calibration methods. For binary models: histogram binning, isotonic regression, bayesian binning into quantiles and platt scaling. For multiclass models: extension of binning methods, matrix and vector scaling and temperature scaling. The one who seems to work better is “temperature scaling”.

Temperature scaling can soften the softmax, so if we do [latex]z_i/T[/latex] the model can be more calibrated. Temperature scaling won’t change the element of the vector [latex]z_i[/latex] that has the maximum value, so the accuracy won’t be affected at all. Personal note: this is linked to another paper I’m reading which indeed mentions that upscaling the values of [latex]z_i[/latex] distorts the confidence levels making the maximum value increase.

The authors conclude with “modern neural networks exhibit a strange phenomenon: probabilistic error and miscalibration worsen even as classification error is reduced”.

[Now Reading] Maxout Networks

Title: Maxout Networks
Authors: Ian J. Goodfellow, David Warde-Farley, Mehdi Mirza, Aaron Courville, Yoshua Bengio
Link: https://arxiv.org/abs/1302.4389

Quick summary:
Maxout is an activation function that takes the maximum value of a bunch of neurons. In one sense, one could think as dropout being similar since dropout will discard some neurons and will pass forward others whereas maxout will only pass the maximum value of some of them. In essence, maxout is like max pooling since it reduces the dimensionality leaving only the maximum values.

It is well explained in the following post: http://www.simon-hohberg.de/blog/2015-07-19-maxout
Goodfellow PhD’s defence (talking about maxout): https://www.youtube.com/watch?v=ckoD_bE8Bhs&t=28m

Nowadays it is also implemented in tf.contrib.layers.maxout but here is a very simple implementation:

def maxout(inputs, num_units, axis=None):
    shape = inputs.get_shape().as_list()
    if axis is None:
        # Assume that channel is the last dimension
        axis = -1
    num_channels = shape[axis]
    if num_channels % num_units:
        raise ValueError('number of features({}) is not a multiple of num_units({})'
             .format(num_channels, num_units))
    shape[axis] = -1
    shape += [num_channels // num_units]
    outputs = tf.reduce_max(tf.reshape(inputs, shape), -1, keep_dims=False)
    return outputs